Which Streamers Share the Most (and Least) Content?
Ever wondered how much overlap there really is between the biggest U.S. streaming services?
Our latest Reelgood data (Movies & Shows | October 2025) breaks it down — comparing how much of each platform’s catalog also appears elsewhere.
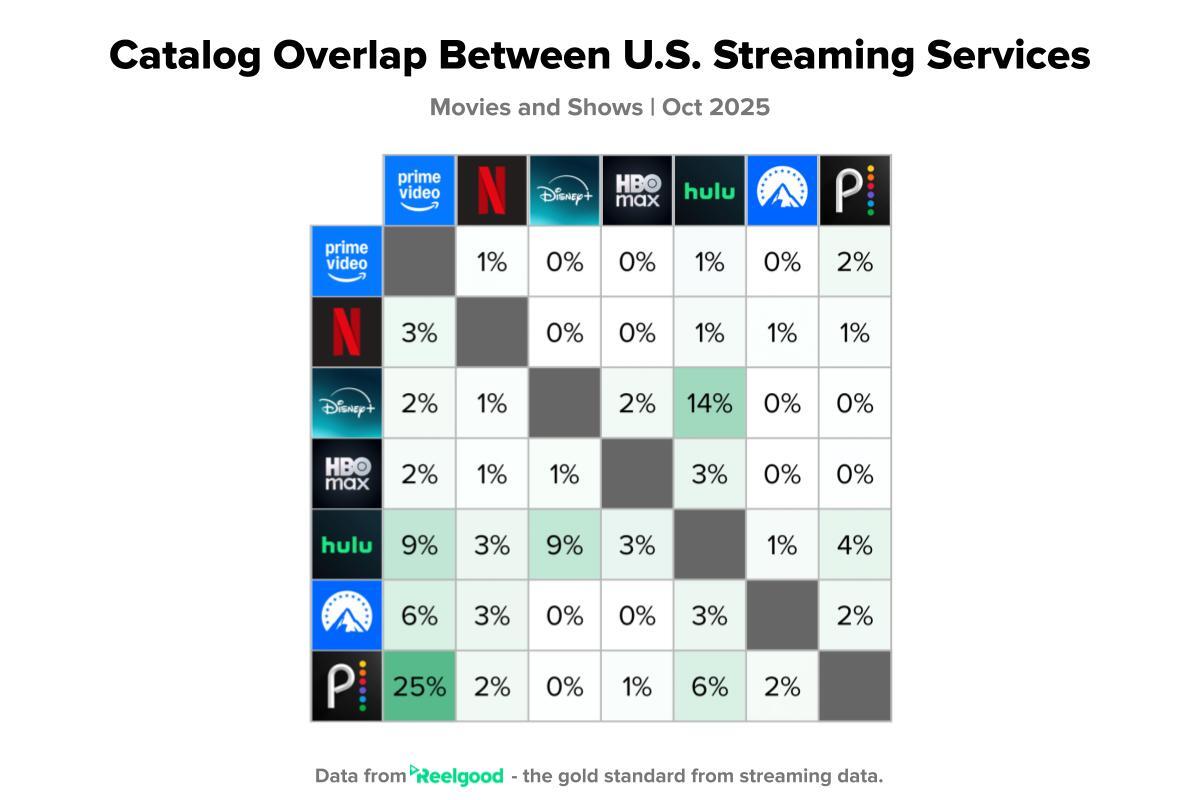
Each percentage represents the share of titles from the row service that are also available on the column service.
For example, 14% of Disney+ titles also appear on Hulu, reflecting their shared corporate ownership and content integrations. Conversely, just 1% of Prime Video’s catalog appears on Netflix, and none of Netflix’s titles appear on Disney+, underscoring Netflix’s continued focus on exclusivity.
Key Takeaways
- Shared Ecosystems Drive Overlap
Disney’s bundle continues to blur the lines between its platforms — the Disney+ ↔ Hulu (14%) overlap is the highest in our analysis, illustrating how cross-service licensing within corporate families can expand reach while maintaining control.Meanwhile, Peacock and Paramount+ show moderate overlaps across several competitors, a reflection of their ongoing use of shared rights and syndication to maximize catalog value.
- Netflix Leads on Exclusivity
Across the major streamers, Netflix stands apart with minimal cross-platform overlap (0–3%). This mirrors its long-standing strategy to emphasize owned and original content rather than licensed titles — a pivot that has made its library one of the most distinctive in the industry. - Catalog Size Shapes Asymmetry
Differences in library volume explain why overlaps are not symmetrical. For instance, only 1% of Prime Video’s titles appear on Netflix, but 3% of Netflix’s catalog appears on Prime Video — showing how a larger service can absorb more shared content while maintaining a lower proportional overlap.
The Bigger Picture
Industry-wide, the trend through 2024–2025 has been toward greater exclusivity paired with selective sharing.
According to Ampere Analysis via OTT Watcher (Sept 2025), 39% of U.S. streaming titles — roughly 67,000 of 172,000 — now appear on two or more platforms, up sharply from 2020. The share of titles available on three or more services has more than doubled, from 9% to 21% over the same period.
This balance of exclusivity and overlap is reshaping the competitive landscape: platforms retain key franchises for differentiation while monetizing back catalogs through FAST channels and short-term licensing.
Meanwhile, viewer behavior continues to diversify. Deloitte’s Digital Media Trends 2025 report finds that the average U.S. household pays for four streaming services (Deloitte Report), while Comscore’s State of Streaming 2025 report shows that the average household watched content from 6.9 streaming services (Comscore Report).
That fragmentation underscores why aggregation tools like Reelgood have become essential for finding where content actually lives.
Why It Matters
Catalog overlap offers a window into:
- Competitive Strategy — how streamers manage exclusivity vs. reach
- Licensing Economics — balancing owned IP with shared distribution
- Viewer Experience — the challenge of finding content across increasingly siloed ecosystems
As the market matures, platforms are refining how they share, license, and wall off content. — and these patterns offer clear insight into where the streaming landscape is headed next.
Data Source: Reelgood | Movies & Shows | U.S. Catalog Overlap (October 2025)
Supporting Reference: Ampere Analysis via OTT Watcher (Sept 2025)
Supplemental Insights: Deloitte Digital Media Trends 2025 | Comscore State of Streaming 2025