The TV Thriller Correction: Thriller Shows Lost Half Their Top 10 Presence in a Year
Thriller appearances on Reelgood’s weekly TV shows Top 10 fell from 122 in H1 2025 to 56 in H1 2026, a 54% decline. Movie thrillers didn’t move.
Television thrillers just went through a correction, and the chart’s biggest genre never flinched:
Drama held 167 of 260 overall Top 10 spots in H1 2025 and 168 in H1 2026, a flat line sitting on top of TV thrillers losing half their chart footprint.
The numbers come from Reelgood’s weekly Streaming Top 10, which ranks the most-streamed movies and shows in the US each week based on the real viewing behavior of Reelgood users across every major service.
In two earlier posts, we tracked the shift at the tag level: [political stories collapsed] and [personal ones took their place]. This post moves one level up, to genre, where the story sharpens into a single correction.
Key Takeaways
- Thriller appearances on the weekly TV shows Top 10 fell 54% year over year. But on the movies list, Thriller was flat: the correction is specifically a television story.
- On the TV shows list, Action & Adventure and Romance took the Thriller’s vacated ground.
- Comedy appearances on the movies list rose 42%, led by Bugonia‘s 12-week run.
- Drama is the most common genre on the chart, appearing on 167 of 260 overall spots in H1 2025 and 168 in H1 2026. Titles carry multiple genres, so the thriller collapse and the comedy, adventure, and romance gains all happened while Drama’s count never moved.
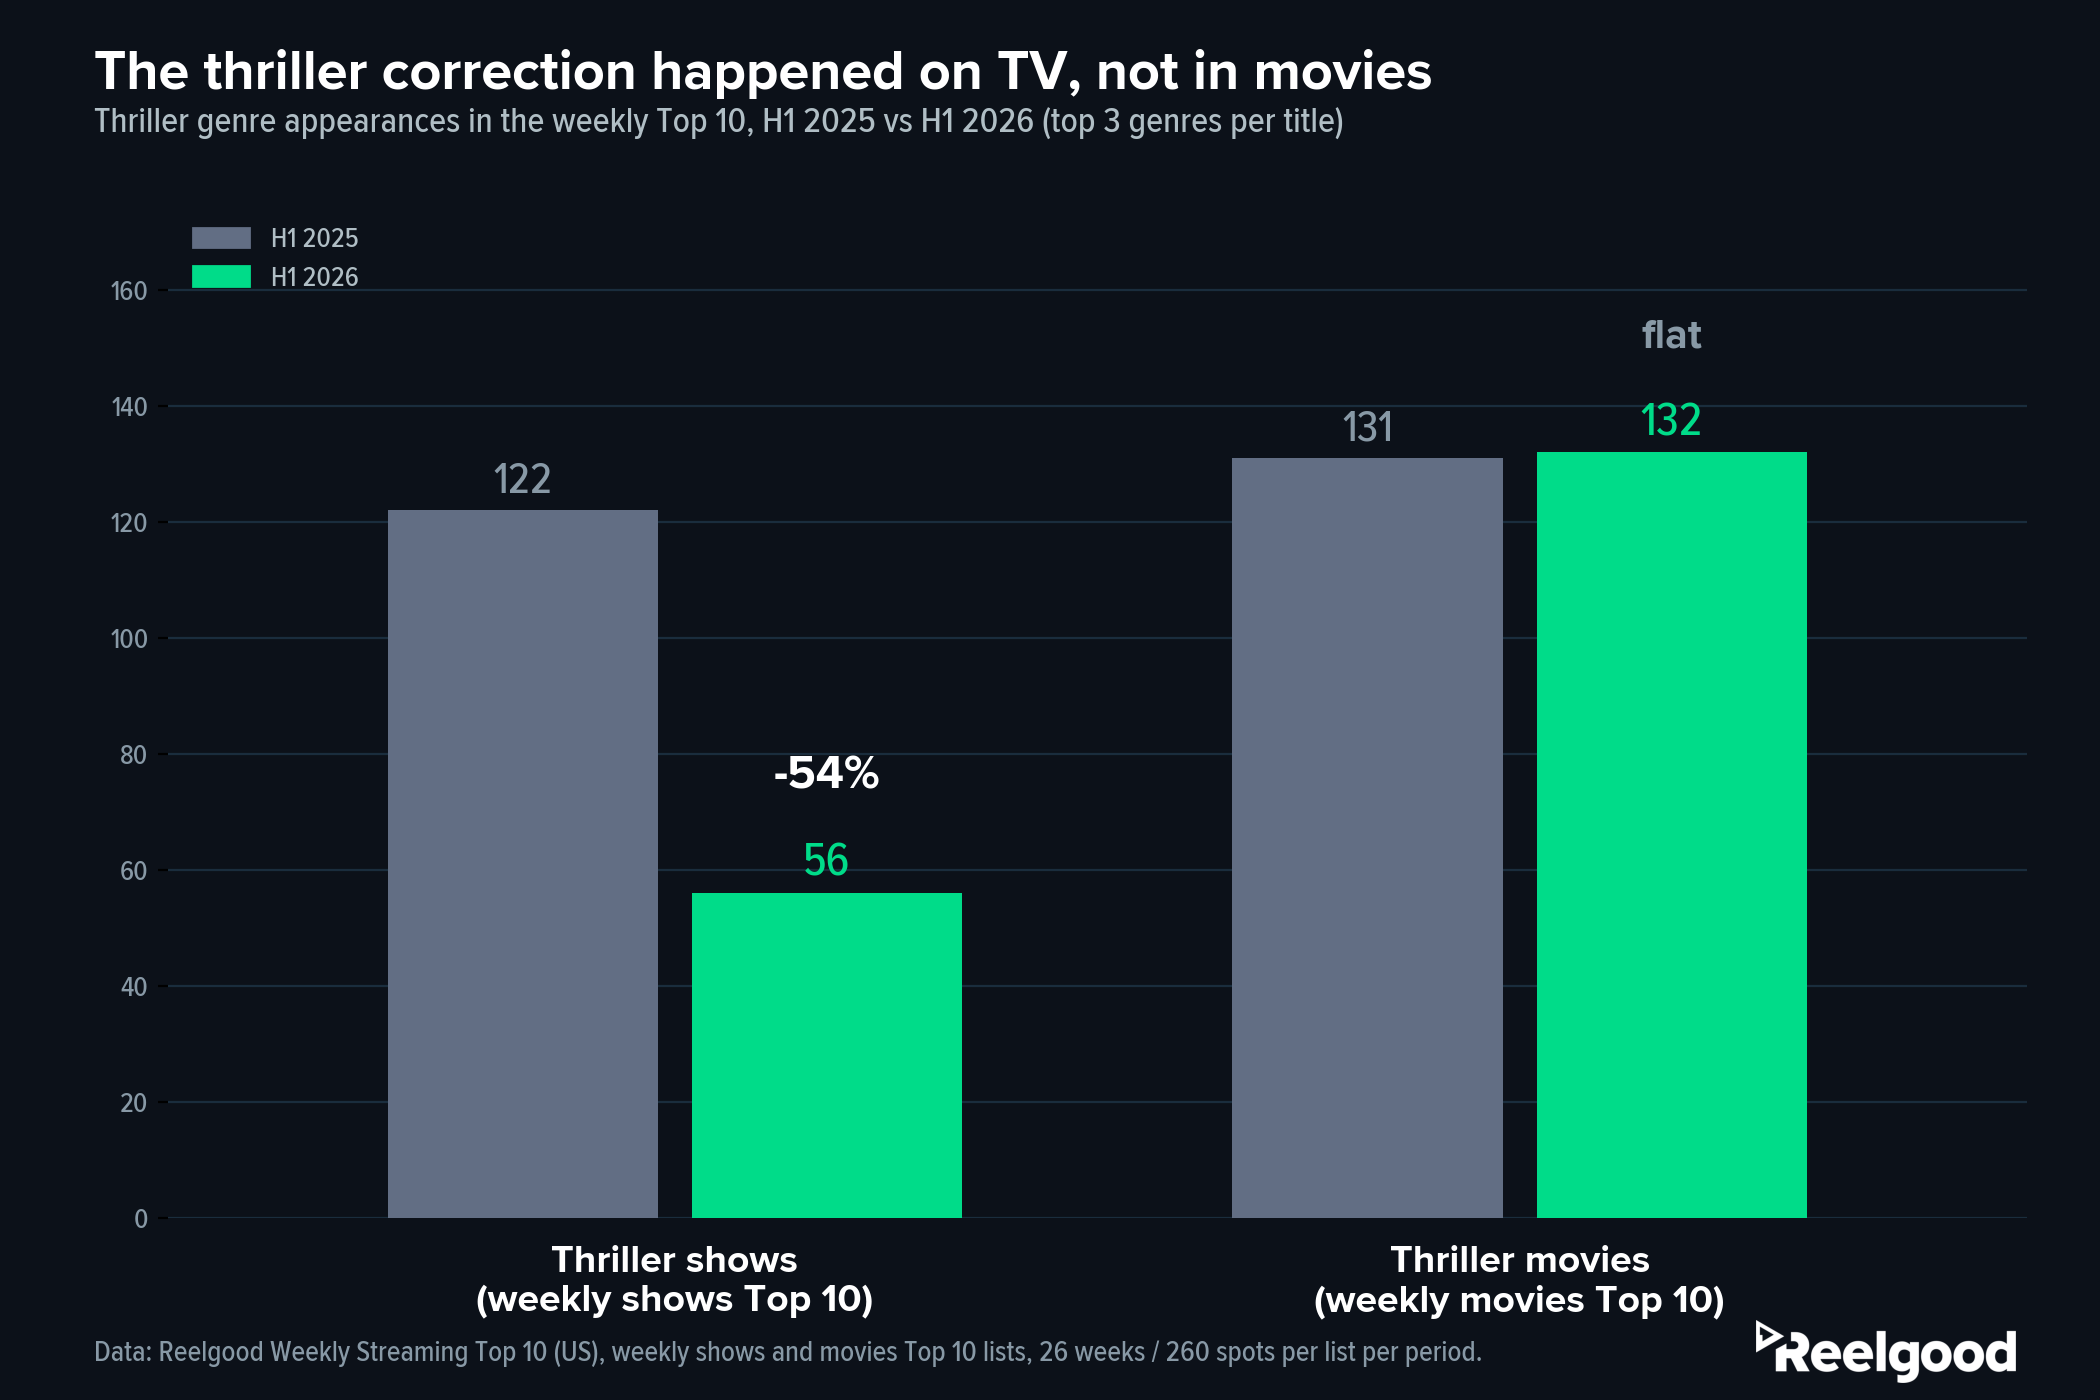
Thriller shows lost 54% of their weekly Top 10 appearances year over year while thriller movies held flat. Data: Reelgood Weekly Streaming Top 10 (US).
The Correction Is Specifically a Television Story
The Thriller decline is not an audience-wide retreat from tension. It’s confined to TV series, and the surrounding genres show where the attention went:
| Genre (list) | H1 2025 | H1 2026 | Change |
|---|---|---|---|
| Thriller (shows) | 122 | 56 | -54% |
| Action & Adventure (shows) | 31 | 55 | +77% |
| Romance (shows) | 9 | 20 | +122% |
| Thriller (movies) | 131 | 132 | flat |
| Comedy (movies) | 52 | 74 | +42% |
| Drama (overall) | 167 | 168 | flat |
The slow-burn prestige thrillers that defined early 2025 television, shows like Severance (13 weeks on the chart in H1 2025), MobLand (11), and Adolescence, gave way to Adventure and Romance as TV’s growth genres. On the movies side, Comedy did the rising, with Bugonia, Send Help, and The Devil Wears Prada all logging multi-week runs.
The Deeper the Taxonomy, the More of the Story You See
This year’s shift took three levels of resolution to read, and each level caught something the one above it missed.
A single blended Thriller number would have shown a modest decline and nothing more. Split by format, it resolves into the real story: a 54% collapse on TV, flat on movies. That’s the same genre data, one level deeper, pointing at a completely different decision.
And genre resolution still has a ceiling.
The bigger rotation, documented in the two earlier posts, happened entirely inside Drama:
Political dramas gave way to relationship dramas, capitals to small towns.
The fading titles and their replacements carried the same genre, so Drama read 167 of 260 overall spots in H1 2025 and 168 in H1 2026. “Drama is stable” is true and useless in equal measure.
Only tag-level data resolves what kind of drama audiences actually moved toward, which is the difference between knowing a category shifted and knowing what to buy.
What Analytics and Insights Teams Should Do With This
If your demand reporting stops at genre, this year is the argument for going deeper. The signal that political stories were fading and relationship stories were rising existed only in tag-level data; genre data compressed that entire rotation into a flat Drama line. That reporting gap is the same one we documented in The Measurement Gap: most services can see what performs on their own platform but not what’s winning attention across all of them, or why.
Request a sample of the weekly rankings history with full metadata at sales@reelgood.com.
Data: Reelgood Movie & TV Metadata & Streaming Availability Database and Reelgood Weekly Streaming Top 10 (US), January 2025 through June 2026. Analysis covers the weekly overall, movies, and shows Top 10 lists as specified, 26 weeks and 260 ranked spots per list per half-year period. Genre counts use each title’s first three genres, reflecting priority order.