Introducing the Streaming Service Popularity Index: Who’s Actually Carrying Streaming’s Demand
Netflix holds an average of 34.2 titles in the US Top 100 movies and shows at any given time. Philo holds 23.6, a smaller number built almost entirely from cable networks it carries rather than content it produces, and it just posted the biggest month-over-month jump on the board.
That gap and that rise are the kind of thing a single hit chart can’t show you, which is why we built a new one.
Today we’re launching the Streaming Service Popularity Index, a monthly ranking of US streaming services by the depth of their in-demand catalog, live now on data.reelgood.com.
Reelgood calls the underlying metric the Popularity Score. On the public page, each service’s score is displayed as the Streaming Ranking Index, a 0 to 10 figure derived from that metric, and the page itself is the Streaming Service Popularity Index.
The first edition, along with the underlying Popularity Score data, is also powering a new vector in State of Streaming’s Unified Streaming Power Index (USPI).
Key Takeaways
- Reelgood’s new Streaming Service Popularity Index scores 19 US streaming services from 0 to 10 based on how many titles each one holds in the national Top 100, not just its single biggest hit.
- Netflix leads at 9.78, followed by Prime Video (8.82) and HBO Max (7.23), for the Jun 24 to Jul 24, 2026 window.
- Philo posted the largest gain on the board, up 1.40 points and two ranking spots.
- The underlying Popularity Score data now feeds State of Streaming’s USPI, which used its August update to look at how a platform’s catalog is built, owned outright versus aggregated from other networks.
The Streaming Ranking Index Measures Catalog Breadth, Not Single Hits
The Streaming Ranking Index is built from title popularity across Reelgood’s application user base.
For every service, we calculate the average number of titles it holds across the US Top 100 most-popular movies and Top 100 most-popular shows over a trailing 30-day window, then place that figure on a fixed 0 to 10 scale, with 35 average titles set as the ceiling.
That ceiling matters. It’s a deliberate ceiling rather than a leader-relative scale, so a service’s score only moves when its own catalog demand changes.
A platform doesn’t gain ground just because the leader had a slow month, which keeps the numbers comparable from one month to the next instead of resetting the curve every time Netflix has a hit.
It’s also a different signal than a typical Top 10 chart.
A service can post one massive breakout title and still look thin the rest of the month. The Popularity Index is measuring breadth:
How many titles a platform is holding in the conversation at once, which is a more durable, plannable kind of demand than a single tentpole.
Philo and AMC+ Climb While Roku Falls
For the Jun 24 to Jul 24, 2026 window, the top of the board looks the way most industry watchers would expect: Netflix, Prime Video, and HBO Max hold the first three spots, with Hulu right behind at 6.87. Where it gets more interesting is what’s moving underneath them.
Philo (6.74) climbed two spots on a 1.40-point gain, the largest increase in this month’s data, and AMC+ (2.80) climbed four spots on a 0.63-point gain.
On the other side, Roku’s Premium Subscriptions tier posted the steepest drop. Premium Subscriptions is Roku’s bundle of paid channels sold through the Roku app, distinct from the separate, free Roku Channel, and it fell 1.02 points and two spots. The standalone Roku Channel wasn’t far behind, down 0.81. Pluto TV and Peacock also lost ground.
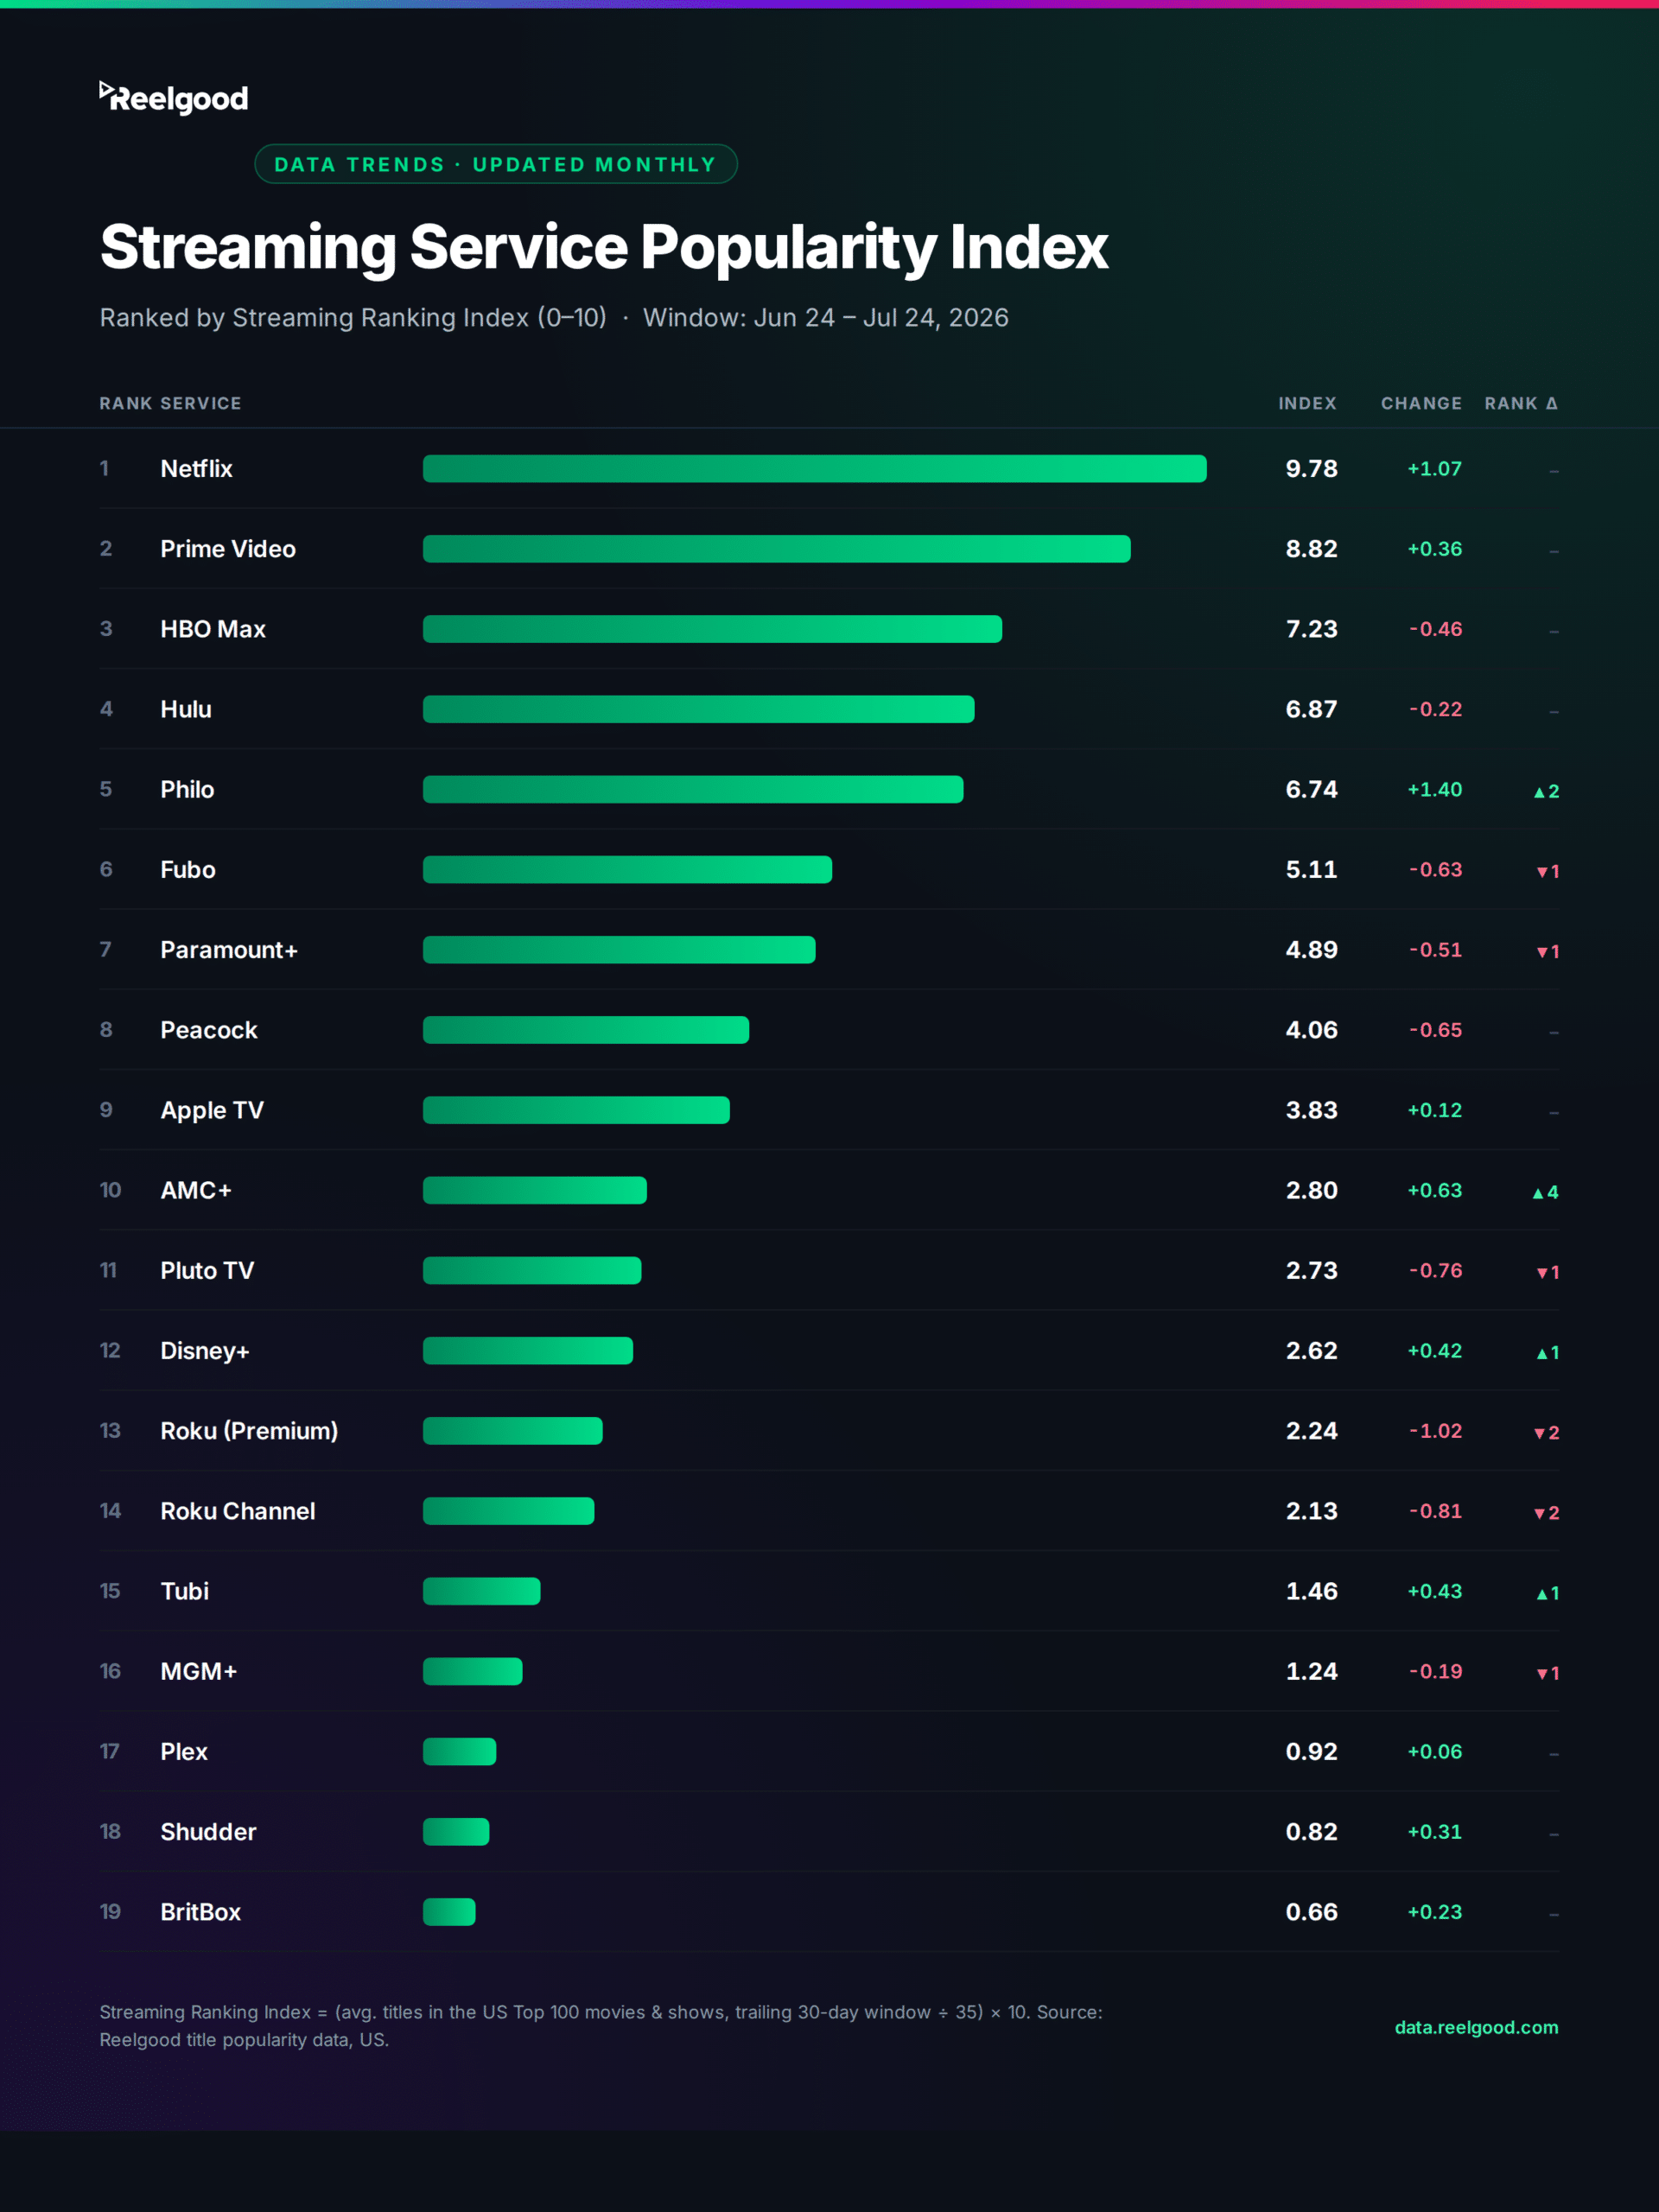
Screenshot of the full Streaming Service Popularity Index ranking table from data.reelgood.com, showing all 19 ranked services with rank, average titles in the US Top 100, Streaming Ranking Index score, and month-over-month change for the Jun 24 to Jul 24, 2026 window.
Catalog Ownership Doesn’t Move the Score, But It Changes What the Score Means
Some of the services on this board build the titles they’re carrying. Others, like Philo, Fubo, and Roku’s Premium Subscriptions tier, are aggregating cable networks or other platforms’ channels inside their own app. The index doesn’t distinguish between the two by design:
It measures demand for whatever titles a service is currently carrying, regardless of who made them.
State of Streaming’s August USPI update looked at this same distinction across the board and grouped services by whether they own their catalog outright or are reselling access to someone else’s, framing it as a question of how repeatable a platform’s current position is likely to be.
It’s a useful lens, and one that Reelgood’s own catalog data supports in a related way.
As we covered in The Measurement Gap, most competitive intelligence in streaming still treats “carrying popular content” as a single flat metric, without distinguishing whether a platform owns that content, licenses it, or is bundling someone else’s app. Ownership doesn’t change a service’s current Popularity Score, but it does change what that score tells you about next month.
Why This Matters for Licensing and Competitive Intelligence Teams
- For content licensing and acquisition teams, the Popularity Index is a monthly read on where in-demand content is concentrated, and the ownership context above adds a useful second layer: knowing whether a platform’s depth is owned or aggregated helps set expectations for how that catalog might change.
- For competitive intelligence and analytics teams, it’s a standing benchmark for where a rival platform’s popular-title depth is trending month to month, the kind of view we’ve also built into our Historical Availability product for tracking windowing and rights changes over time.
The Streaming Service Popularity Index rebuilds every month with a full scorecard, the biggest risers and fallers, and a month selector as more history accumulates.
If your licensing team needs the title-level data behind any of these rankings, or your competitive intelligence team wants ongoing tracking on a specific rival’s catalog depth, email our data team.
Data: Reelgood title popularity data across the Reelgood application user base (US), Jun 24 to Jul 24, 2026 measurement window, published August 3, 2026. Streaming Ranking Index = (average titles in the US Top 100 movies and shows over a trailing 30-day window ÷ 35) × 10.