Streaming’s #1 Spot Is a Revolving Door: A Week at the Top Measures Launch, Not Demand
In 79 weeks of Reelgood’s overall Streaming Top 10, no title has held #1 for three consecutive weeks. Of 69 reigns at the top, 59 lasted exactly one week.
The “#1 today” badge is streaming’s favorite trophy. Netflix made it famous when it added Top 10 rows to its apps in 2020, and some version of it now shows up in trailers, press releases, and app screens across the industry.
Put every service’s releases on one chart, though, and the badge measures something narrower than it implies: not how much a title is loved, but how big its launch week was. In a market-wide ranking, where every service’s titles compete at once, nobody keeps the top spot.
The numbers come from Reelgood’s weekly Streaming Top 10, built on real-time, first-party interaction data from Reelgood users in the US, covering the overall list (movies and shows) from January 2025 through early July 2026.
Key Takeaways
- No title has held #1 for three straight weeks in the entire 79-week dataset. 59 of 69 reigns lasted exactly one week; the other 10 lasted two.
- H1 2026 crowned 24 different #1 titles in 26 weeks, up from 21 the year before. Twelve of the 24 were entirely new to the chart and entered at #1, and only one (Spider-Noir) held the top spot two weeks running.
- The year’s most durable titles barely touched the top: The Pitt spent 15 weeks on the overall chart with a single week at #1, and The Boys (7 weeks) and Fallout (6) never reached it at all.
- The eleven titles with 5+ week runs held 30% of all H1 2026 chart spots but only 8 of the 26 weeks at #1. Peak rank and sustained demand answer different questions, and in this data, excelling at one said little about the other.
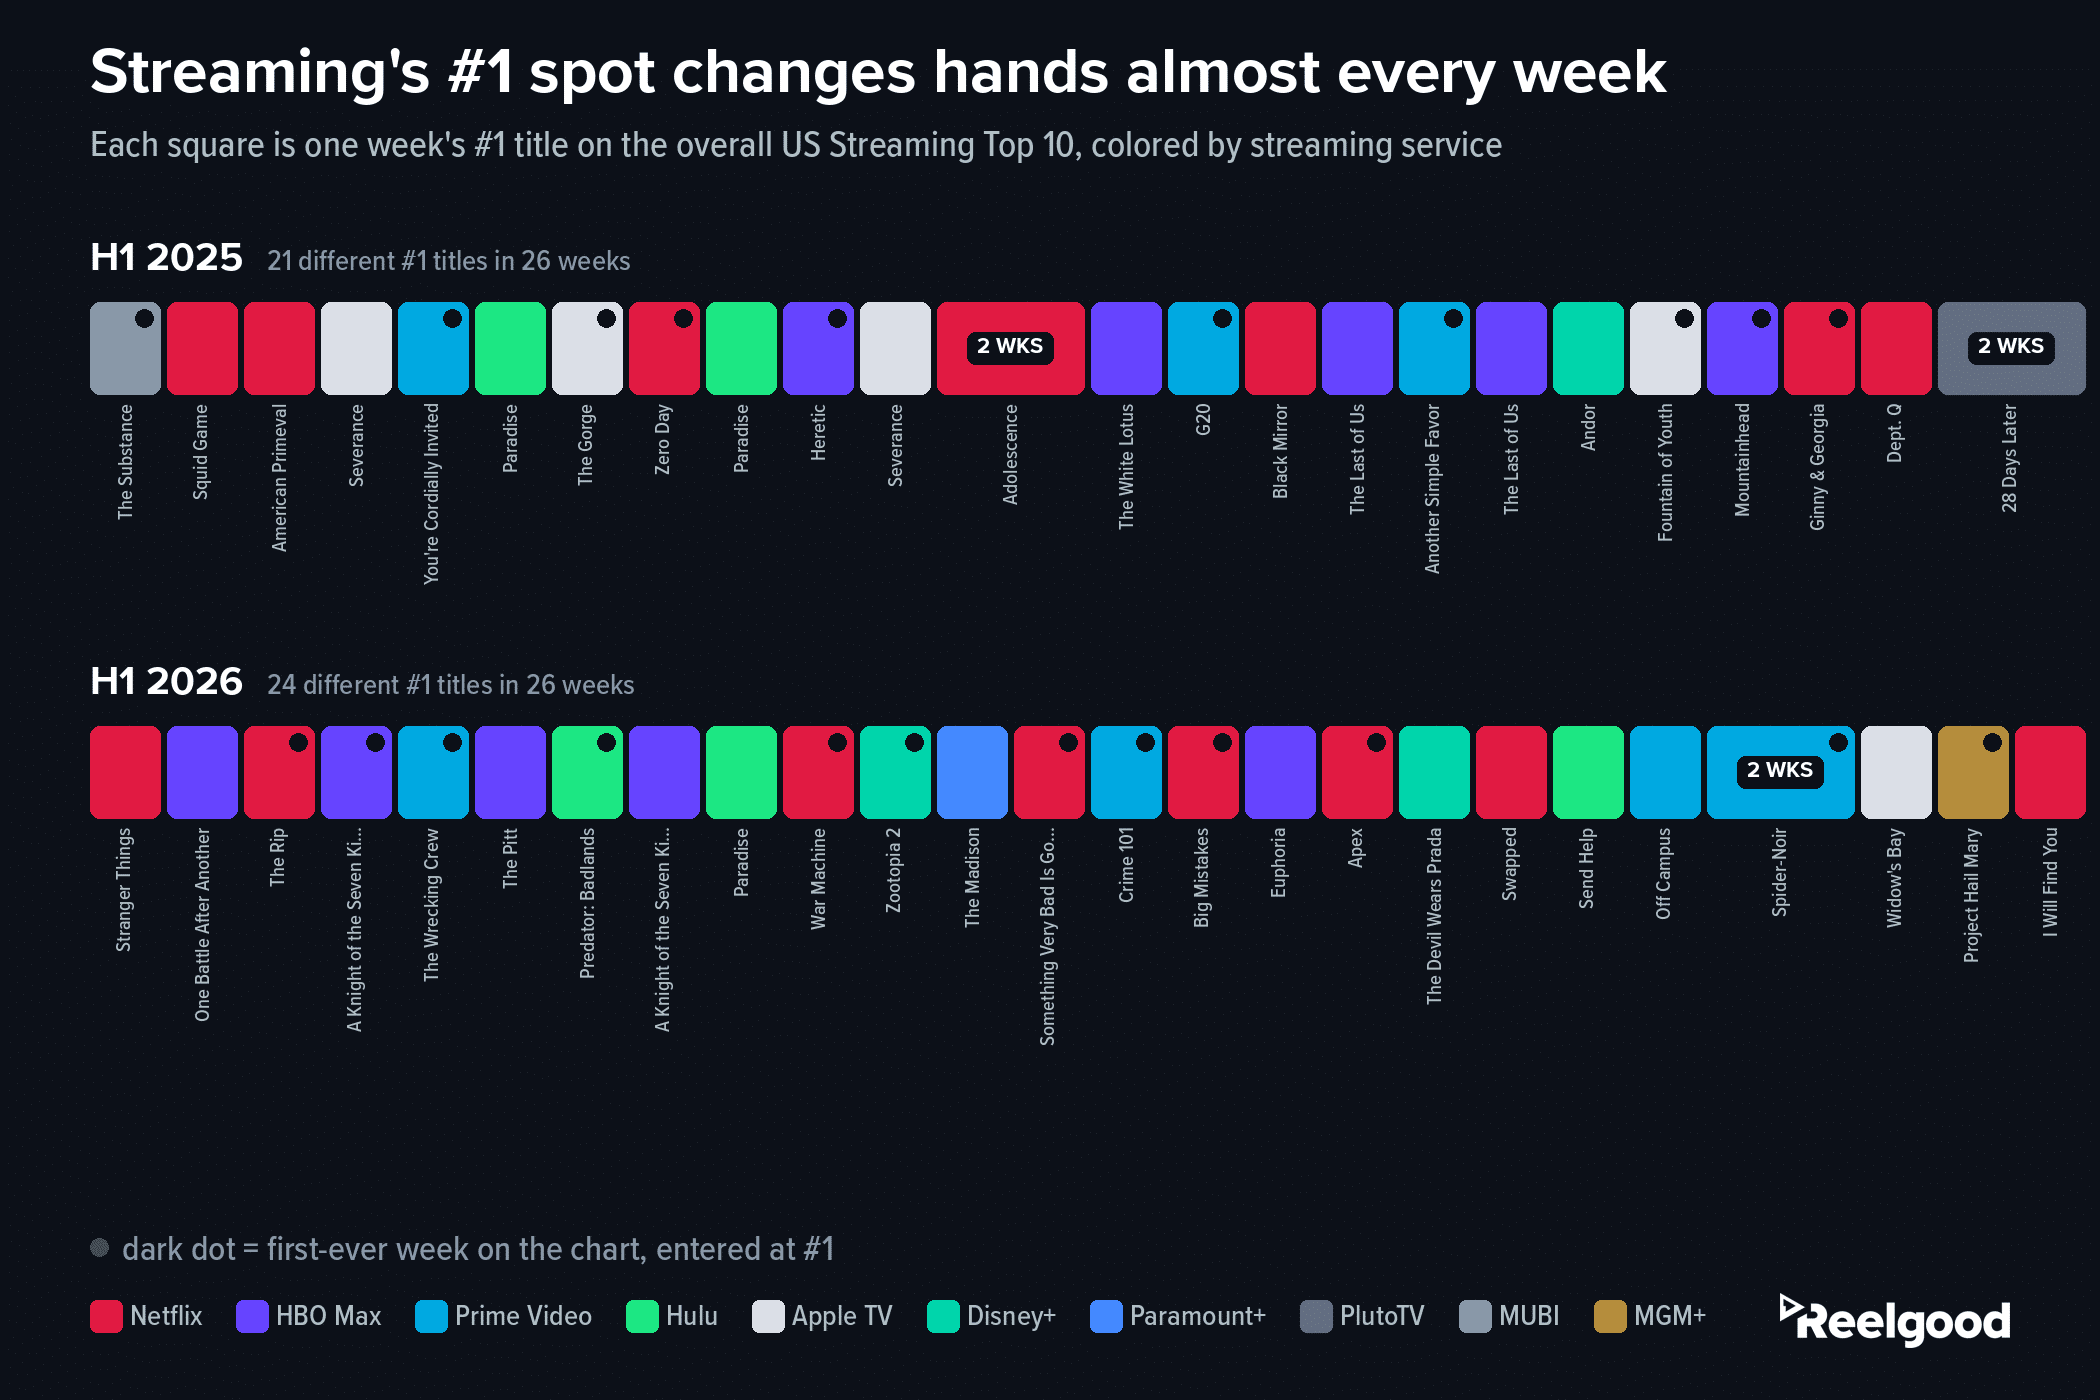
26 weeks, 24 different #1 titles: no title has held the top of the overall Top 10 for three straight weeks in the dataset’s 79 weeks. Data: Reelgood Weekly Streaming Top 10 (US).
Twenty-Four #1s in Twenty-Six Weeks
The top of the chart behaves like a launch calendar. In H1 2026, 24 different titles took the #1 spot in 26 weeks, and half of them (12) debuted there: their first week ever on the chart was their week at the top. Almost none came back for a second.
That’s not a fluke of one half-year.
H1 2025 ran the same way with 21 different #1s, and across all 79 tracked weeks the longest reign anyone has managed, Adolescence, 28 Days Later, Spider-Noir, and a handful of others, is two weeks.
Netflix’s release engine wins the spot more often than anyone
(8 weeks at #1 in both halves), and even so, its reigns cycle like everyone else’s. In this data, holding the top isn’t something any service does.
The Chart’s Real Winners Rarely Sit at #1
Flip to the titles that actually dominated the period and the top spot nearly disappears from their story.
The Pitt logged 15 weeks on the overall chart, more than any title in the dataset’s 18 months, and was #1 for exactly one of them. The Boys and Fallout combined for 13 chart weeks without a single week at #1. Bugonia ran 5 weeks and never got past #3.
As a group, H1 2026’s eleven longest-running titles held 78 of the chart’s 260 spots, about 30%, while collecting just 8 weeks at #1 among them.
The #1 spot went to whatever launched that week; the rest of the chart is where demand actually accumulated.
Read the Badge as a Launch Metric, and Measure the Rest
None of this makes “#1” meaningless.
It makes it specific: proof a title won its debut window, which is worth knowing and worth marketing.
The mistake is treating it as a proxy for lasting demand,
whether you’re sizing up a rival’s “#1” claim in a competitive deck or judging your own slate by peaks.
For analytics and insights teams, the fix is to read the two measurements separately:
- Peak rank for launch execution, weeks-on-chart and
- Rank depth for sustained demand.
As our release-strategy analysis showed, tenure is also the metric release decisions can actually move.
Request a sample of the weekly rankings history with full metadata at data@reelgood.com.
Data: Reelgood Movie & TV Metadata & Streaming Availability Database and Reelgood Weekly Streaming Top 10 (US), January 2025 through early July 2026 (79 tracked weeks; half-year comparisons use the 26-week first halves of 2025 and 2026). Analysis covers the weekly overall Top 10 list. A reign is one or more consecutive weeks at #1 by the same title. Each spot is attributed to the service that received the highest number of Reelgood user interactions for that title in that week; interactions are users’ real-time, organic engagements with titles on Reelgood, with promoted activity excluded, and attribution does not imply exclusivity. SVOD/AVOD titles only.