What Streaming Buyers Are Actually Acquiring: How to Read Catalog Changes for Licensing and Sales
Over the past few months I have sat in on a string of conversations with content strategy, acquisition, and sales leaders at production companies and independent distributors. The companies could not have been more different: a Canadian studio selling scripted series into Europe, a mid-size studio building a slate for underrepresented audiences, an indie distributor that runs its own horror streaming service. Different catalogs, different budgets, different audiences.
They kept asking the same question. Who is buying what right now, and where?
It is a simple question with an expensive answer. Most of these teams do not have a data science group.
The honest version of their current process is reaching out to studios one by one and piecing together a picture by hand. One distributor told me they got almost nothing usable from the vendor they had been paying. That is the gap. And the fastest way to close it is to watch how streaming catalogs actually change.
Key Takeaways
- Production and distribution teams keep asking the same three things:
- who is licensing my kind of content,
- in which territories, and
- how long does it stay up.
- Year-over-year catalog changes are the clearest public signal of where buyer appetite is moving. They show which services are deepening into a genre and which are pulling back.
- The same catalog data drives three different decisions:
- what to greenlight or acquire,
- which streaming services to pitch to in sales, and
- how to price a title given how widely it is already available.
- Smaller studios and distributors feel this most. Without a data team, they are making licensing and sales calls on information that is often months out of date.
The Question Every Seller Is Really Asking
Strip away the differences and the conversations rhymed.
Everyone wanted to know which services are acquiring which genres, and in which markets.
The studio selling into Europe wanted to track who buys scripted series in the UK, Canada, and the EU5, and how many titles in a given genre each service had added over the last year. The horror distributor wanted to know which platforms were investing in horror so its sales team could prioritize the right targets instead of cold-calling everyone.
Everyone wanted historical availability and windowing.
Not just where a title is today, but the pattern:
- when it went up,
- how long it stayed,
- how many services carried it at once, and
- when it came down.
The horror distributor had noticed licensing windows clustering around five months and wanted data to confirm it. The studio building a slate for underrepresented audiences wanted on-and-off dates so it could tell whether a title was genuinely addressable or locked into an exclusive.
This is the windowing intelligence I wrote about in why historical streaming availability data is a strategic necessity, and it is now table stakes for anyone making rights decisions.
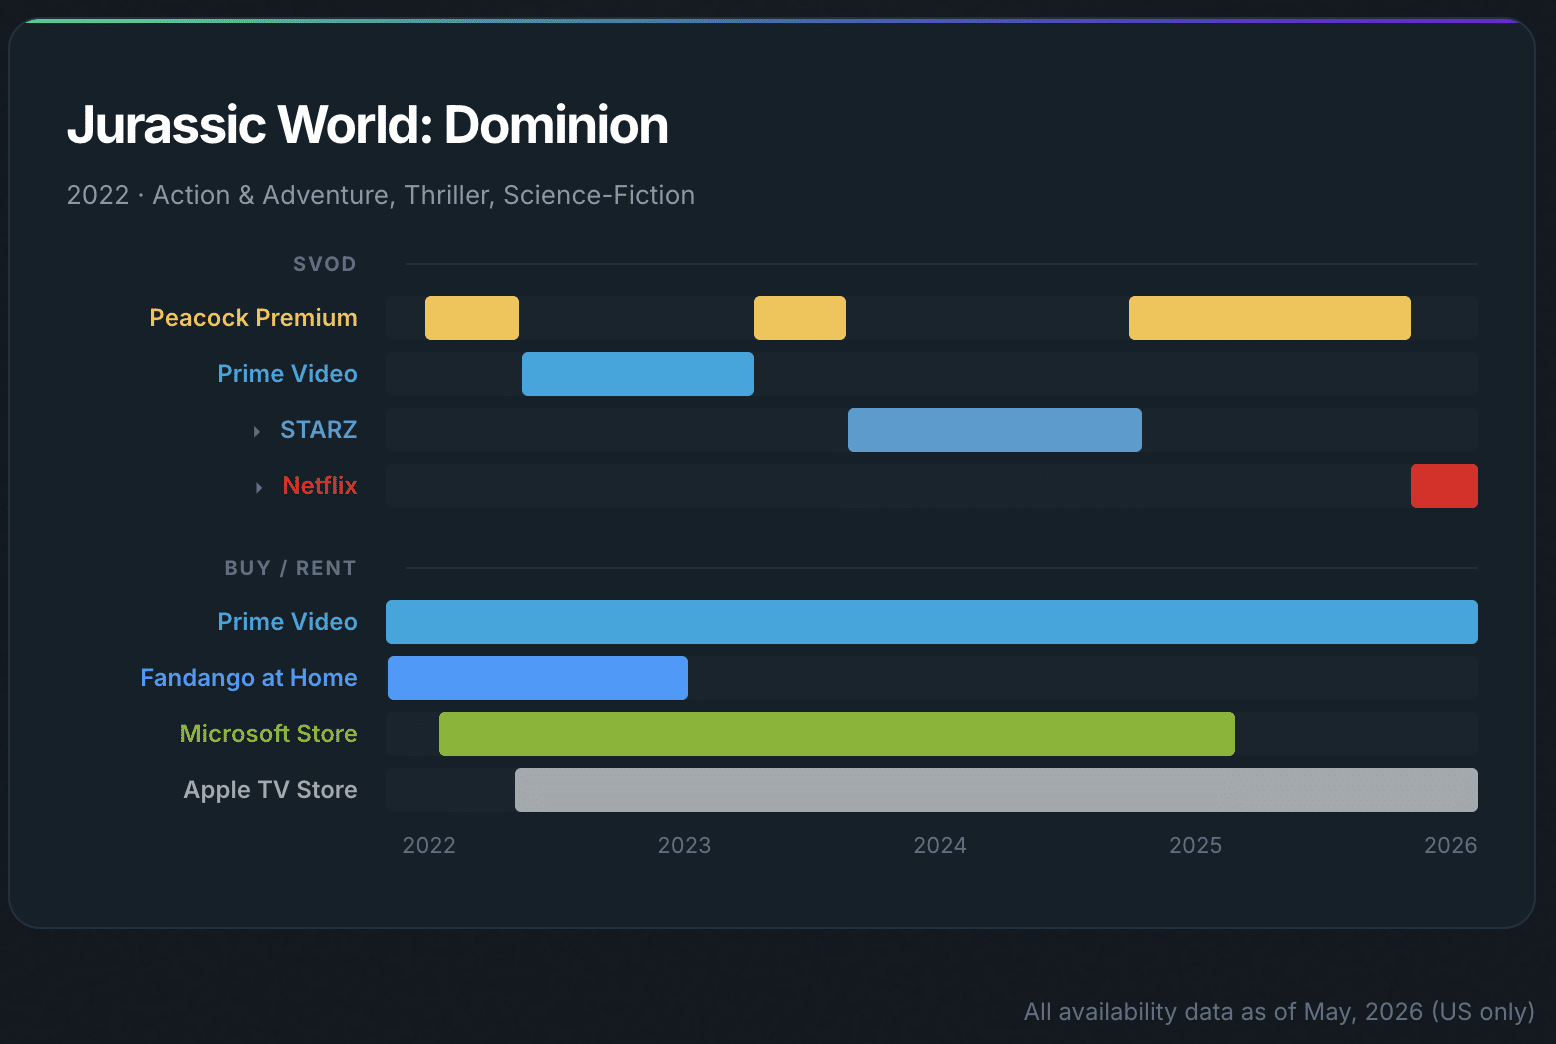
A single title makes the point. A recent tentpole like Jurassic World: Dominion has bounced across Peacock, Prime Video, and STARZ on subscription since its 2022 release, landed on Netflix only in 2026, and stayed continuously available to buy or rent the entire time. A seller who checks only where it lives today misses the whole pattern: the cadence of the windows, how long each one ran, and which services overlapped.
Jurassic World: Dominion, US streaming availability 2022 to 2026.” Reelgood historical availability chart.
And everyone wanted competitive context.
How does my catalog compare to the platforms I sell to or against?
One distributor wanted its horror library benchmarked against competitors for marketing. Another wanted sub-genre granularity, dystopian or female-lead rather than just “sci-fi” or “drama,” to better position recent titles. These teams are not short on instinct. They are short on a current, comparable view of the market, the same blind spot I covered in the measurement gap.
Catalog Changes Are the Clearest Signal of Buyer Appetite
When a service adds or sheds titles in a genre, it is telling you where its money is going.
Track that across services over a year and you have a map of demand.
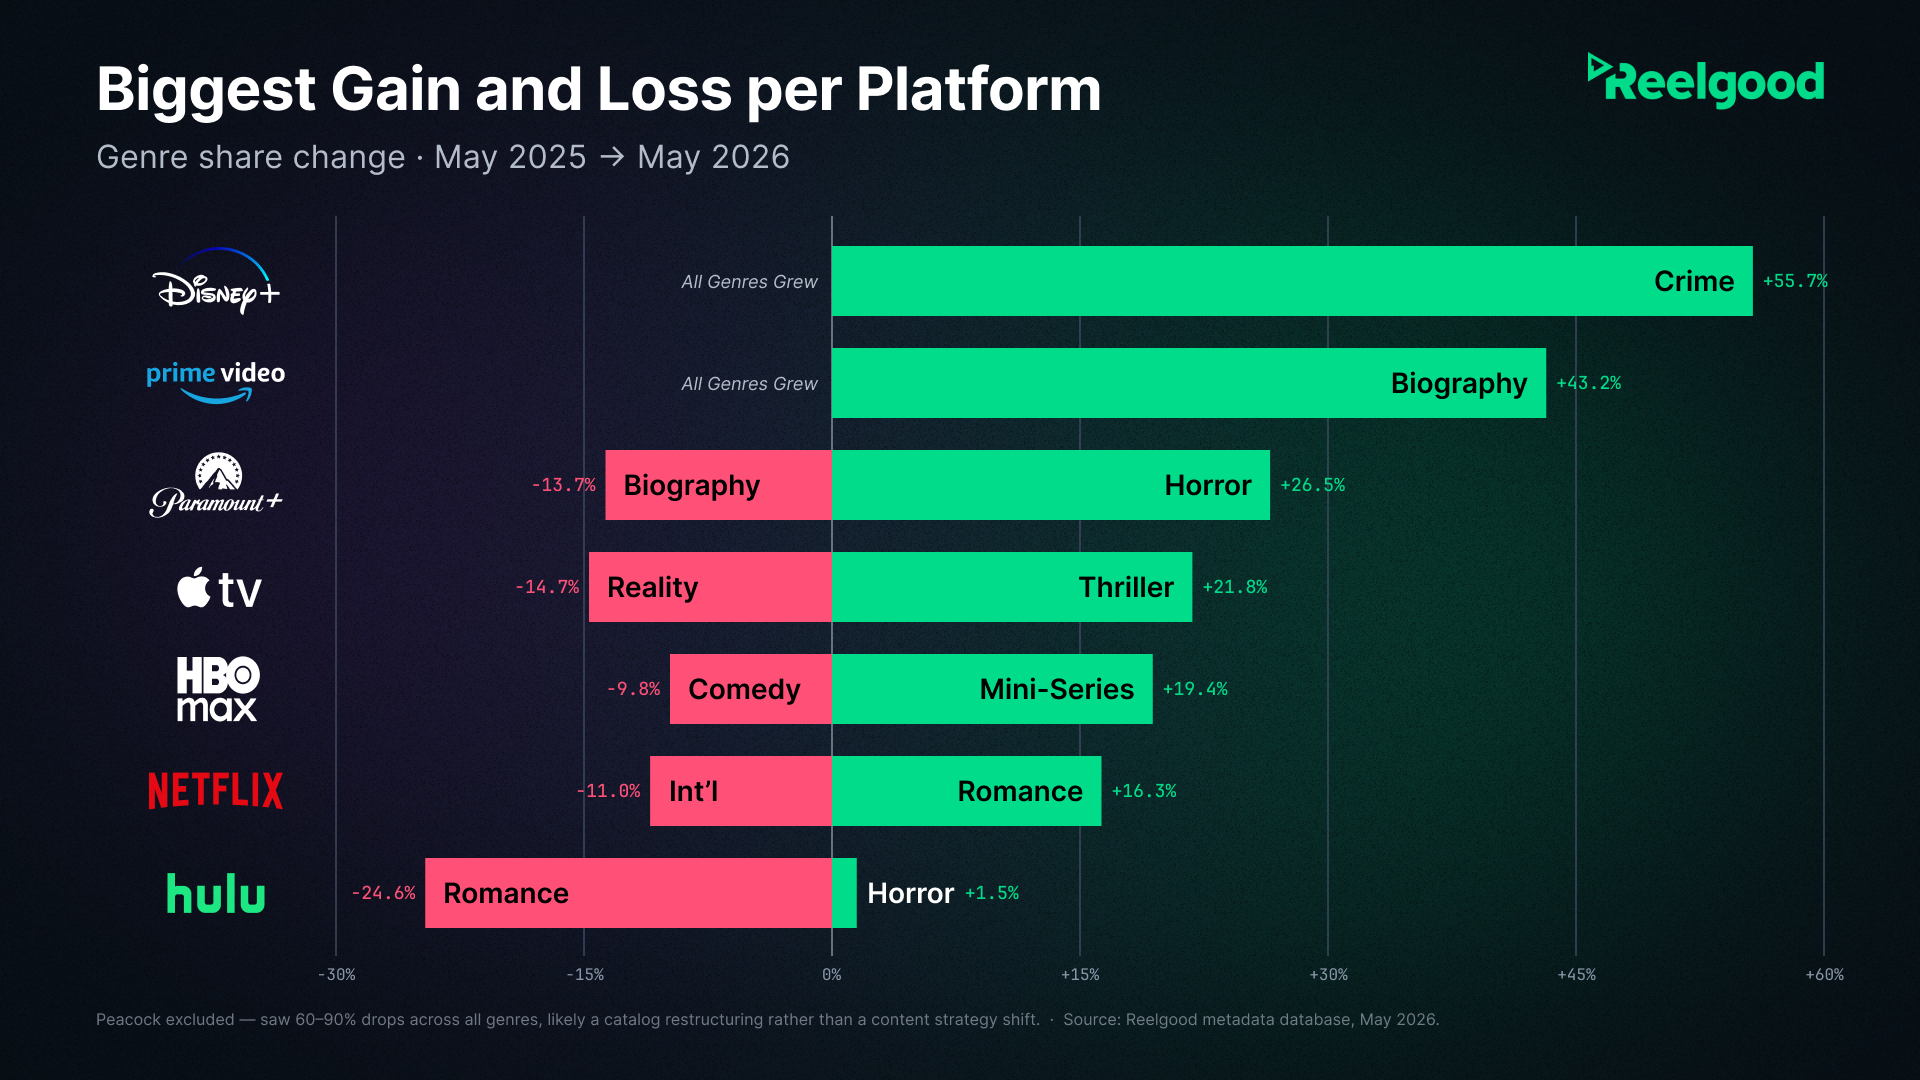
We built one comparing genre composition across the major platforms from May 2025 to May 2026.
Largest Genre Changes in Major Streaming Services Content Catalog, May 2025 to May 2026.
The moves are specific, and each one is a signal a seller can act on.
Disney+ grew its Crime catalog by 56% year over year, from 70 titles to 109, alongside double-digit gains in drama and reality. A platform most people still file under family and animation is quietly buying heavier, more adult content. If you are selling crime drama, that is a door that was closed two years ago and is open now.
Paramount+ deepened horror by 27% and live sport by 24%. Netflix leaned into romance, suspense, and sport, each up about 16%. Meanwhile the contractions are just as loud: Peacock’s catalog shrank 66% year over year, with its movie library down roughly 80% after a mid-2025 cull, and Hulu’s catalog fell about 10%.
A title widely available across a shrinking platform is a very different licensing conversation than one a growing platform is hunting for.
Mid-tier services tell their own story.
BritBox grew its catalog 36%, weighted heavily toward documentary and drama. AMC+ runs nearly half horror by share. For a distributor with a horror slate, that combination, which services are deepest in horror and which are actively adding it, is a sales target list.
Same Data, Three Decisions
The reason catalog-change data keeps coming up across such different companies is that it feeds three jobs at once.
For content licensing and acquisition, it informs what to greenlight or buy.
If you are weighing a slate of scripted thrillers, knowing that three of the eight major platforms grew that genre this year and one cut it hard changes the forecast.
For distribution and sales, it builds the target list and the pitch.
Pair a genre trend with comp-title performance and a seller walks into the room knowing which service is most likely to buy and why. That beats pitching the same package to everyone.
For pricing and rights strategy, breadth of availability sets the floor.
A studio planning a FAST channel told me, correctly, that if a title is already everywhere, the price should reflect that. A distributor making an “ad-free” or exclusivity claim in its marketing needs to verify the title is actually exclusive before the claim ships. Both are availability questions, and both have a wrong answer that costs money.
None of this requires a data team. It requires a current, comparable view of where titles live and how that is changing. That is the streaming intelligence these teams were missing, and once they see it, the manual studio-by-studio outreach stops making sense.
See What Your Buyers Are Building
If you are deciding what to license, where to sell, or how to price, you should not be working from a picture that is months old, or worse, trying to manually identify where titles have been available. And certainly not relying on LLMs or AI tools to tell you as recent LLM streaming accuracy data shows!
- Acquisition and content strategy teams: request a genre-trend view across the services and territories you care about.
- Distribution and sales teams: ask for a competitive catalog and windowing breakdown to build your target list.
- Rights and pricing teams: pull historical availability for your titles to verify exclusivity and benchmark breadth.
Start with the Reelgood metadata request form or email sales@reelgood.com, and we will put a sample together around your catalog.
Data: Reelgood Movie & TV Metadata & Streaming Availability Database, genre composition compared May 2025 vs. May 2026. Catalog counts cover on-demand subscription and free (AVOD) availability. Prime Video totals reflect the consolidation of Freevee into the Prime catalog.