Which Streamers Own the Top 10? Netflix Leads on Volume, HBO Max on Staying Power
Netflix needed 37 different titles to hold its 66 weekly Top 10 spots in the first half of 2026, more than any other service. HBO Max reached 48 spots with just 15.
Every streaming service claims momentum.
The weekly Top 10 is where those claims meet an audience.
We took the 260 overall Top 10 spots from the first half of 2026 and the 260 from the same 26 weeks of 2025, attributed each to the service where the title got the most attention that week, and counted who actually held it. The numbers come from Reelgood’s weekly Streaming Top 10, built on real-time, first-party interaction data from Reelgood users in the US.
After four parts on the Top 10’s themes and genres, this time the lens is the services themselves: who gained ground, who gave it up, and the two very different ways streamers earn their share.
Key Takeaways
- Netflix led both periods and grew, from 61 of 260 overall Top 10 spots in H1 2025 (23.5%) to 66 in H1 2026 (25.4%). It also held exactly 8 weeks at #1 in both halves.
- Prime Video and HBO Max were the biggest gainers, up 10 spots each. Prime Video’s share of the shows-only Top 10 more than doubled, from 24 spots to 50.
- Apple TV was the biggest decliner, falling from 32 overall spots to 19, with Widow’s Bay accounting for 9 of the 19.
- The leaders win differently: Netflix’s 66 spots came from 37 titles (about 1.8 weeks each), while HBO Max’s 48 came from 15 titles (3.2 weeks each), led by The Pitt‘s 15-week run.
- A single film can put a service on the map: MUBI’s entire 9-spot presence in H1 2025 was The Substance. In H1 2026, STARZ went from zero H1 spots to 5 (led by The Housemaid) and MGM+ (4 spots) made its first chart appearances in this dataset.
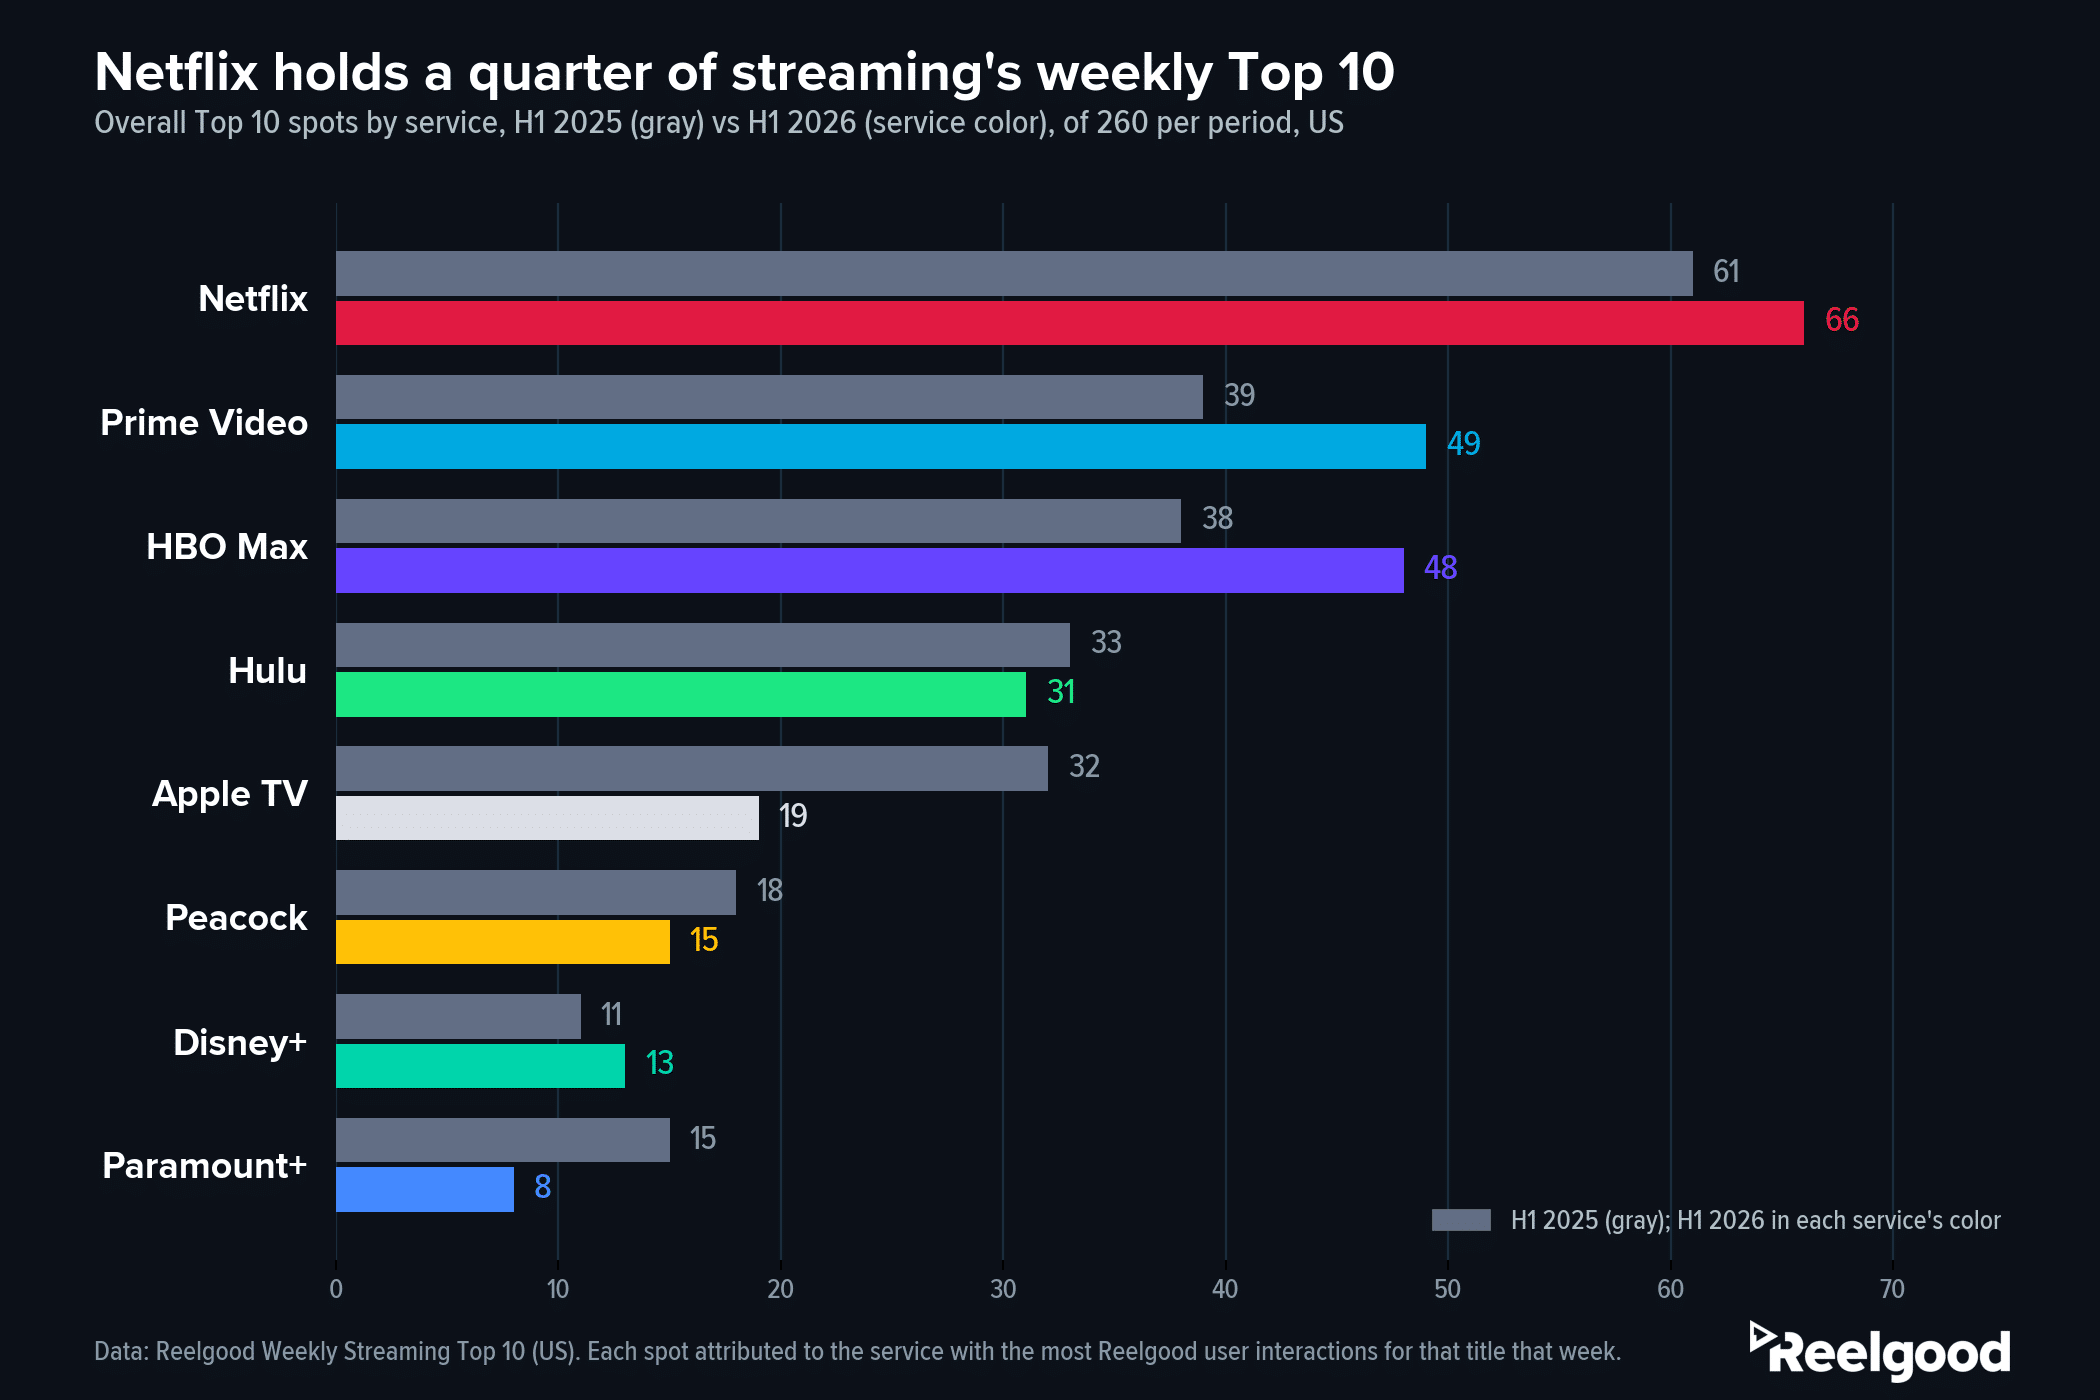
Netflix held 66 of 260 overall Top 10 spots in H1 2026 (25.4%), ahead of Prime Video (49) and HBO Max (48). Data: Reelgood Weekly Streaming Top 10 (US).
Netflix Leads the Top 10, and the Race Behind It Reordered
Netflix’s lead is steady and slightly growing: a quarter of all overall Top 10 spots, the most #1 weeks, and more distinct charting titles than any two rivals combined. Behind it, the order changed.
| Service | H1 2025 | H1 2026 | Change |
|---|---|---|---|
| Netflix | 61 spots (23.5%) | 66 spots (25.4%) | +5 |
| Prime Video | 39 (15.0%) | 49 (18.8%) | +10 |
| HBO Max | 38 (14.6%) | 48 (18.5%) | +10 |
| Hulu | 33 (12.7%) | 31 (11.9%) | -2 |
| Apple TV | 32 (12.3%) | 19 (7.3%) | -13 |
| Peacock | 18 (6.9%) | 15 (5.8%) | -3 |
| Disney+ | 11 (4.2%) | 13 (5.0%) | +2 |
| Paramount+ | 15 (5.8%) | 8 (3.1%) | -7 |
Smaller services moved too: STARZ went from zero spots to 5 and MGM+ from zero to 4, while MUBI fell from 9 to zero.
The totals tell you who’s winning. The more useful story is how differently those totals were built, and it splits the leaders into two camps.
Prime Video’s Gains Came From TV. Apple TV’s Losses Came From Its Schedule
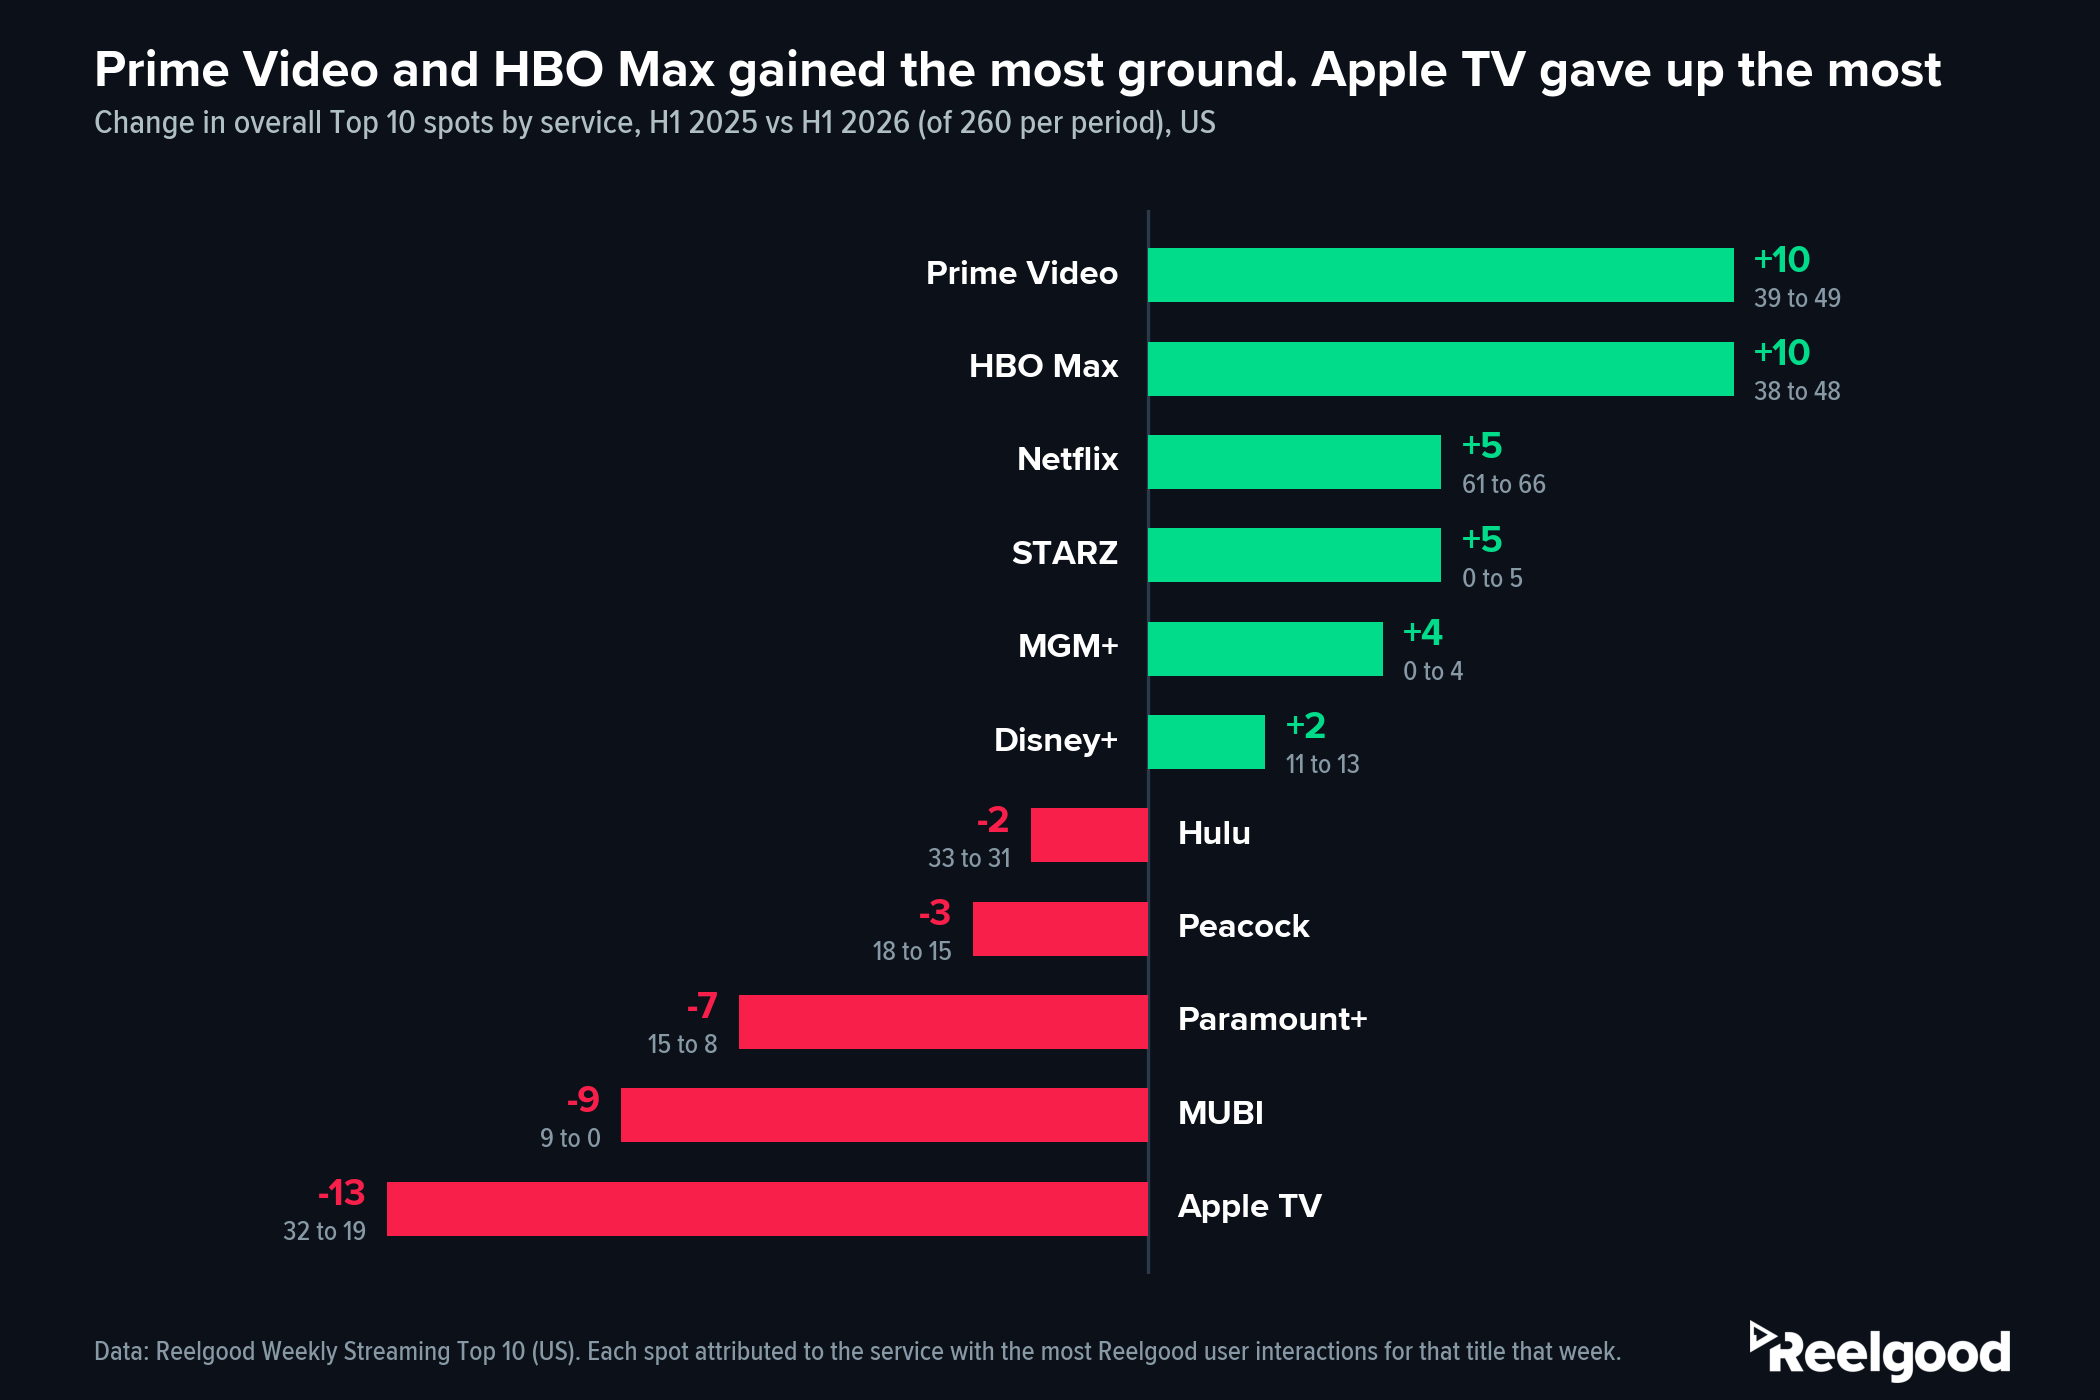
Prime Video and HBO Max each gained 10 overall Top 10 spots year over year; Apple TV gave up 13. Data: Reelgood Weekly Streaming Top 10 (US).
Prime Video’s gain is a television story.
Reelgood publishes three weekly Top 10 lists (overall, shows, and movies, each with its own 260 spots per half), and on the shows-only list, Prime Video went from 24 spots to 50, driven by Fallout (7 weeks), The Boys (7), The Night Manager (6), and Spider-Noir (5). A year earlier its best show was Reacher at 6 weeks with little behind it; in 2026 it had five shows charting five weeks or more.
HBO Max’s gain is a tentpole story.
The Pitt alone held a Top 10 spot for 15 of 26 weeks, with Euphoria (7) and A Knight of the Seven Kingdoms (6) behind it.
Apple TV’s decline mirrors what dropped off its chart.
Its H1 2025 presence was built on Severance (10 weeks), Your Friends & Neighbors (7), and Silo (4). In H1 2026, Severance and Silo were absent from the Top 10 entirely, Your Friends & Neighbors returned but cracked the overall list only once, and Widow’s Bay‘s 9-week run carried nearly half of what remained.
Peacock’s slip shows up one list over: its movies-list presence fell from 36 spots to 22.
And then there’s MUBI, the cleanest illustration in the dataset of what one title can do: all 9 of its H1 2025 spots came from The Substance. When the film’s run ended, so did the service’s chart presence.
Volume and Staying Power Are Two Different Games
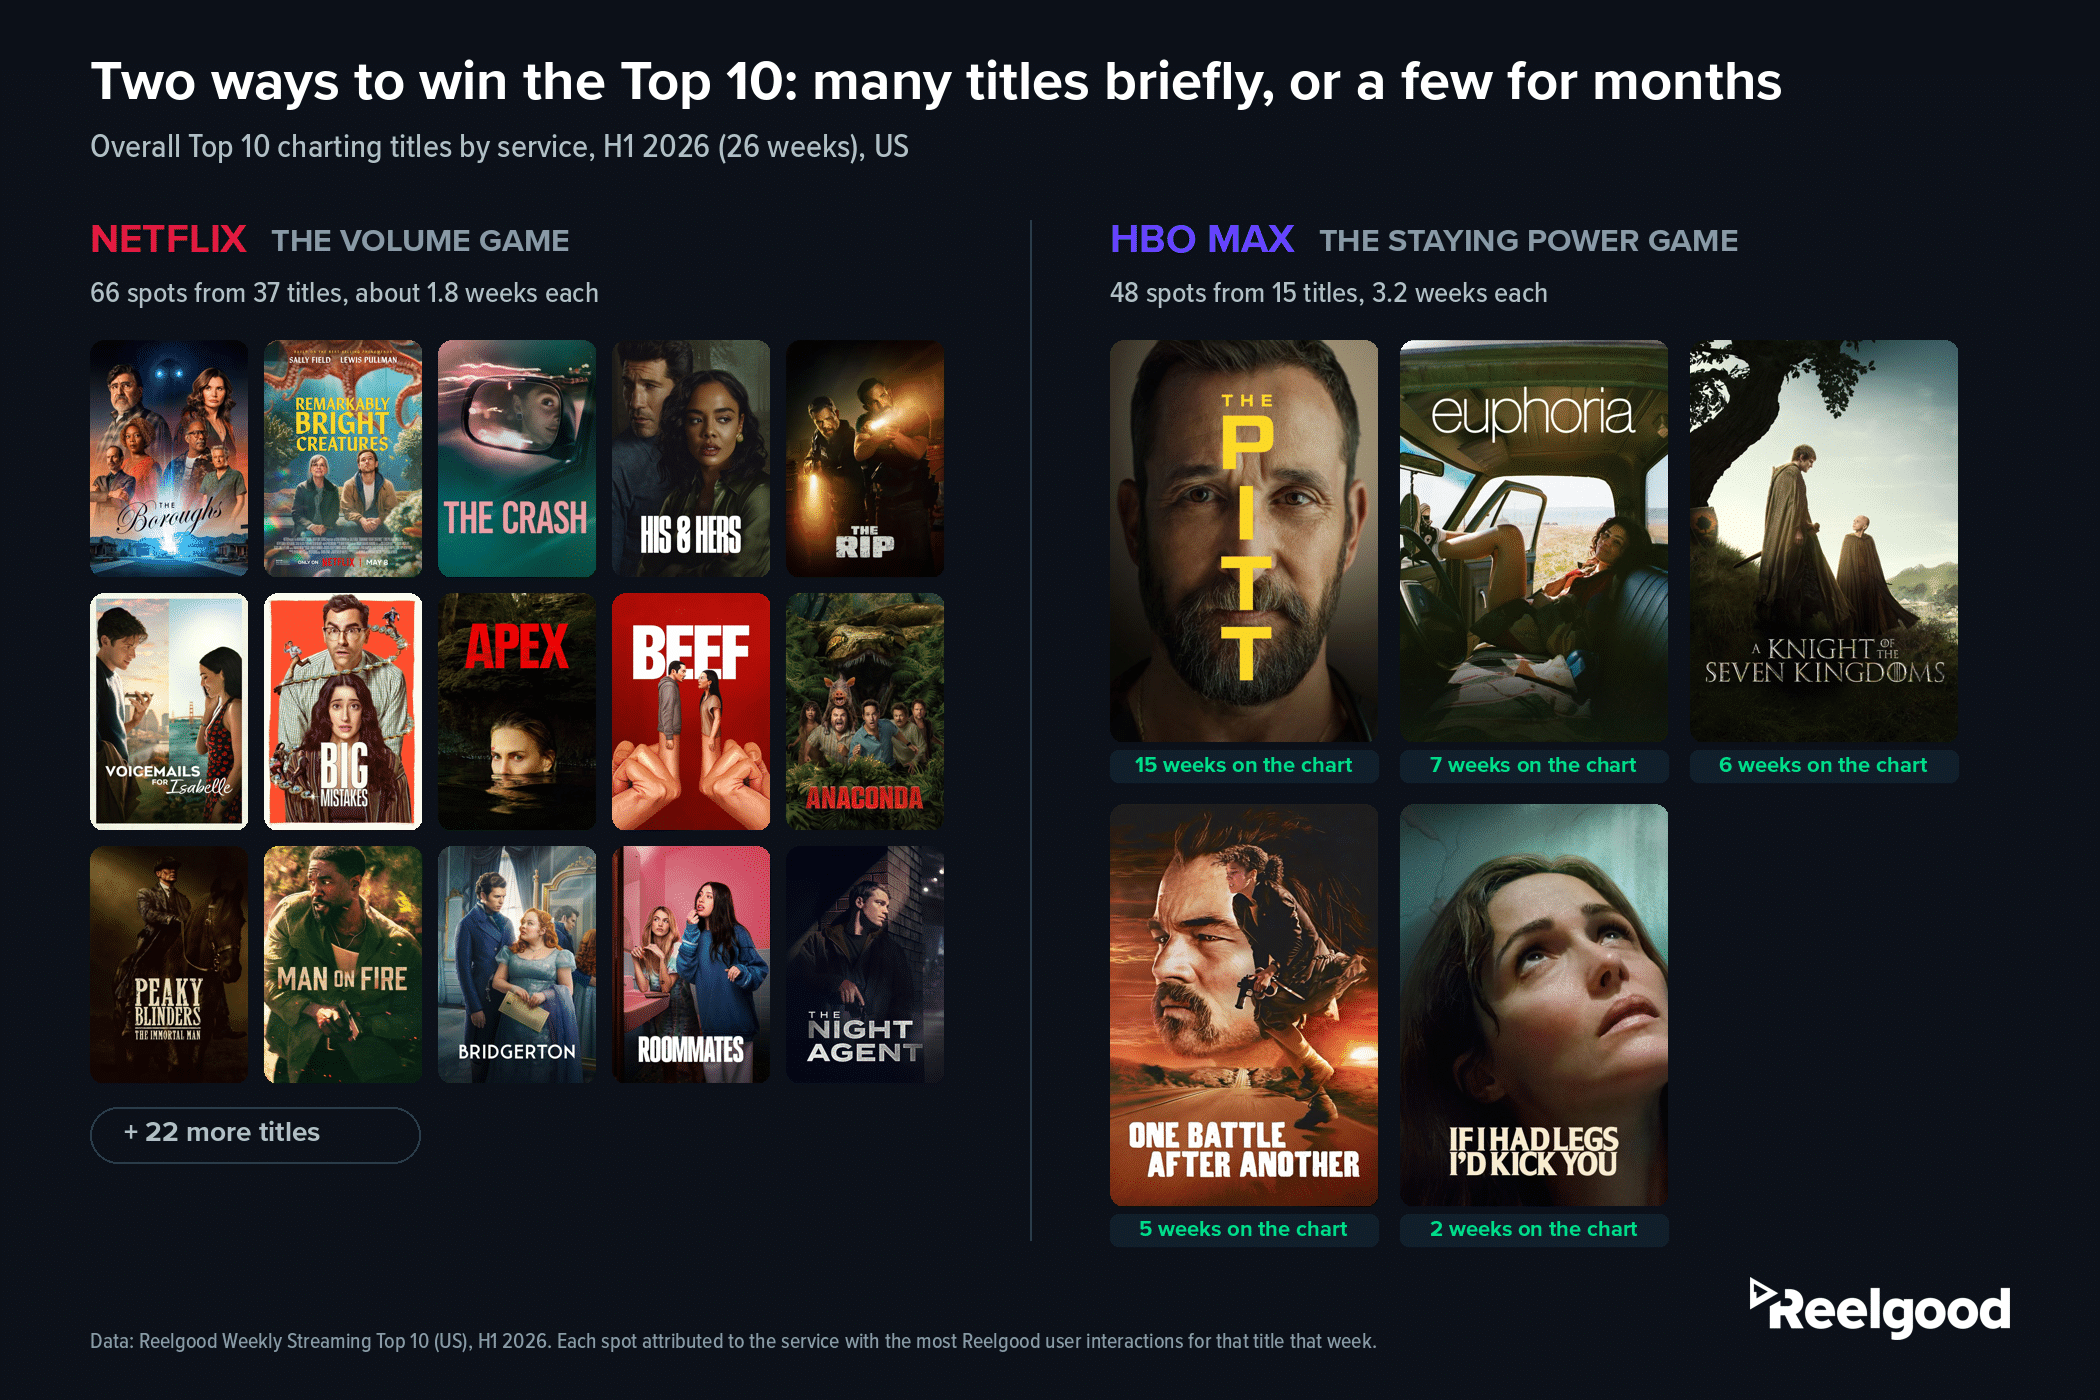
Netflix’s 66 Top 10 spots came from 37 different titles; HBO Max’s 48 came from just 15, led by The Pitt’s 15-week run. Data: Reelgood Weekly Streaming Top 10 (US), H1 2026.
Netflix and HBO Max built their leads in nearly opposite ways.
Divide each service’s spots by its number of charting titles and the two models emerge.
- Netflix averaged about 1.8 weeks per charting title: a constant churn of new entries, few of them lasting.
- HBO Max averaged 3.2 weeks per title: fewer swings, longer holds.
- Prime Video sits between at 2.5, with a 2026 slate that leaned toward the HBO Max model.
Neither approach is free.
The volume model needs a release engine that can keep feeding the chart; the tentpole model needs its few bets to land. But they read very differently in competitive analysis:
A service gaining share on breadth is widening its funnel, while one gaining share on runs is concentrating attention. A share number alone doesn’t distinguish them; the title-level data underneath it does.
What Competitive and Analytics Teams Can Do With This
Most Top 10 data is published per service, by the services themselves, so it can tell you what won on Netflix but not whether Netflix won the week.
A single chart built on cross-service viewing behavior is what lets you compute share at all: share of actual audience attention, not catalog size or subscriber counts. For an analytics team, the practical move is a standing weekly view: your service’s share of chart spots, your rivals’, and the titles driving each, updated weekly rather than reconstructed quarterly. That’s the gap between knowing Prime Video “had a good spring” and knowing its show-list share doubled and exactly which four series did it.
As we documented in The Measurement Gap, most services can see what performs on their own platform but not what’s winning attention across all of them.
If you want to build that standing view, start with the data behind this post: request a sample of the weekly rankings history with full metadata, including week-by-week service attribution for every charting title, at data@reelgood.com.
Data: Reelgood Movie & TV Metadata & Streaming Availability Database and Reelgood Weekly Streaming Top 10 (US), January 2025 through June 2026. Analysis covers the weekly overall Top 10 list (26 weeks and 260 ranked spots per half-year period) except where the shows or movies list is specified. Each spot is attributed to the service that received the highest number of Reelgood user interactions for that title in that week; attribution does not imply the title was exclusive to that service. Rankings are based solely on organic interactions (promoted activity excluded) and include titles available on SVOD and/or AVOD services. Peacock figures reflect Peacock Premium.