Binge Buys a Week. Weekly Buys a Season: What Release Strategy Does to Top 10 Staying Power
Netflix put 27 different shows on Reelgood’s weekly TV Top 10 in the first half of 2026, almost twice as many as any other service. Not one lasted more than 5 weeks. The Pitt, released weekly, charted for 17.
The binge-versus-weekly debate is usually argued with anecdotes. Eighteen months of Top 10 data turns it into a measurement, and the measurement is lopsided: shows released weekly dominate the chart’s long runs, while all-at-once seasons spike and vanish.
The numbers come from Reelgood’s weekly Streaming Top 10, built on real-time, first-party interaction data from Reelgood users in the US, comparing the first halves of 2025 and 2026 on the TV shows list. The release calendar schedules more than the show. It schedules the demand.
Key Takeaways
- On the H1 2026 shows Top 10, Netflix charted 27 different shows, the most of any service, but averaged just 2.1 weeks per show, and its longest run was 5 weeks. Eight of its 27 charted exactly once.
- The services built on weekly episodes hold the chart longest: HBO Max averaged 4.5 weeks per charting show (led by The Pitt at 17) and Apple TV 4.1 (led by Shrinking at 11). The same gap held in H1 2025: HBO Max 6.1, Apple TV 4.7, Netflix 2.6.
- Weekly runs aren’t thin occupancy: The Pitt spent 12 of its 17 weeks in the top 3, and all three externally verified weekly rollouts (The Pitt, The Boys, Fallout) kept charting for one to two weeks after their finales.
- Netflix’s longest show runs of the full 18 months came when it staggered its own releases: Stranger Things (8 weeks, released in three volumes) and Wednesday (7 weeks, in two parts). Exactly one conventional all-at-once season, The Beast in Me (7), ran longer than 6 weeks.
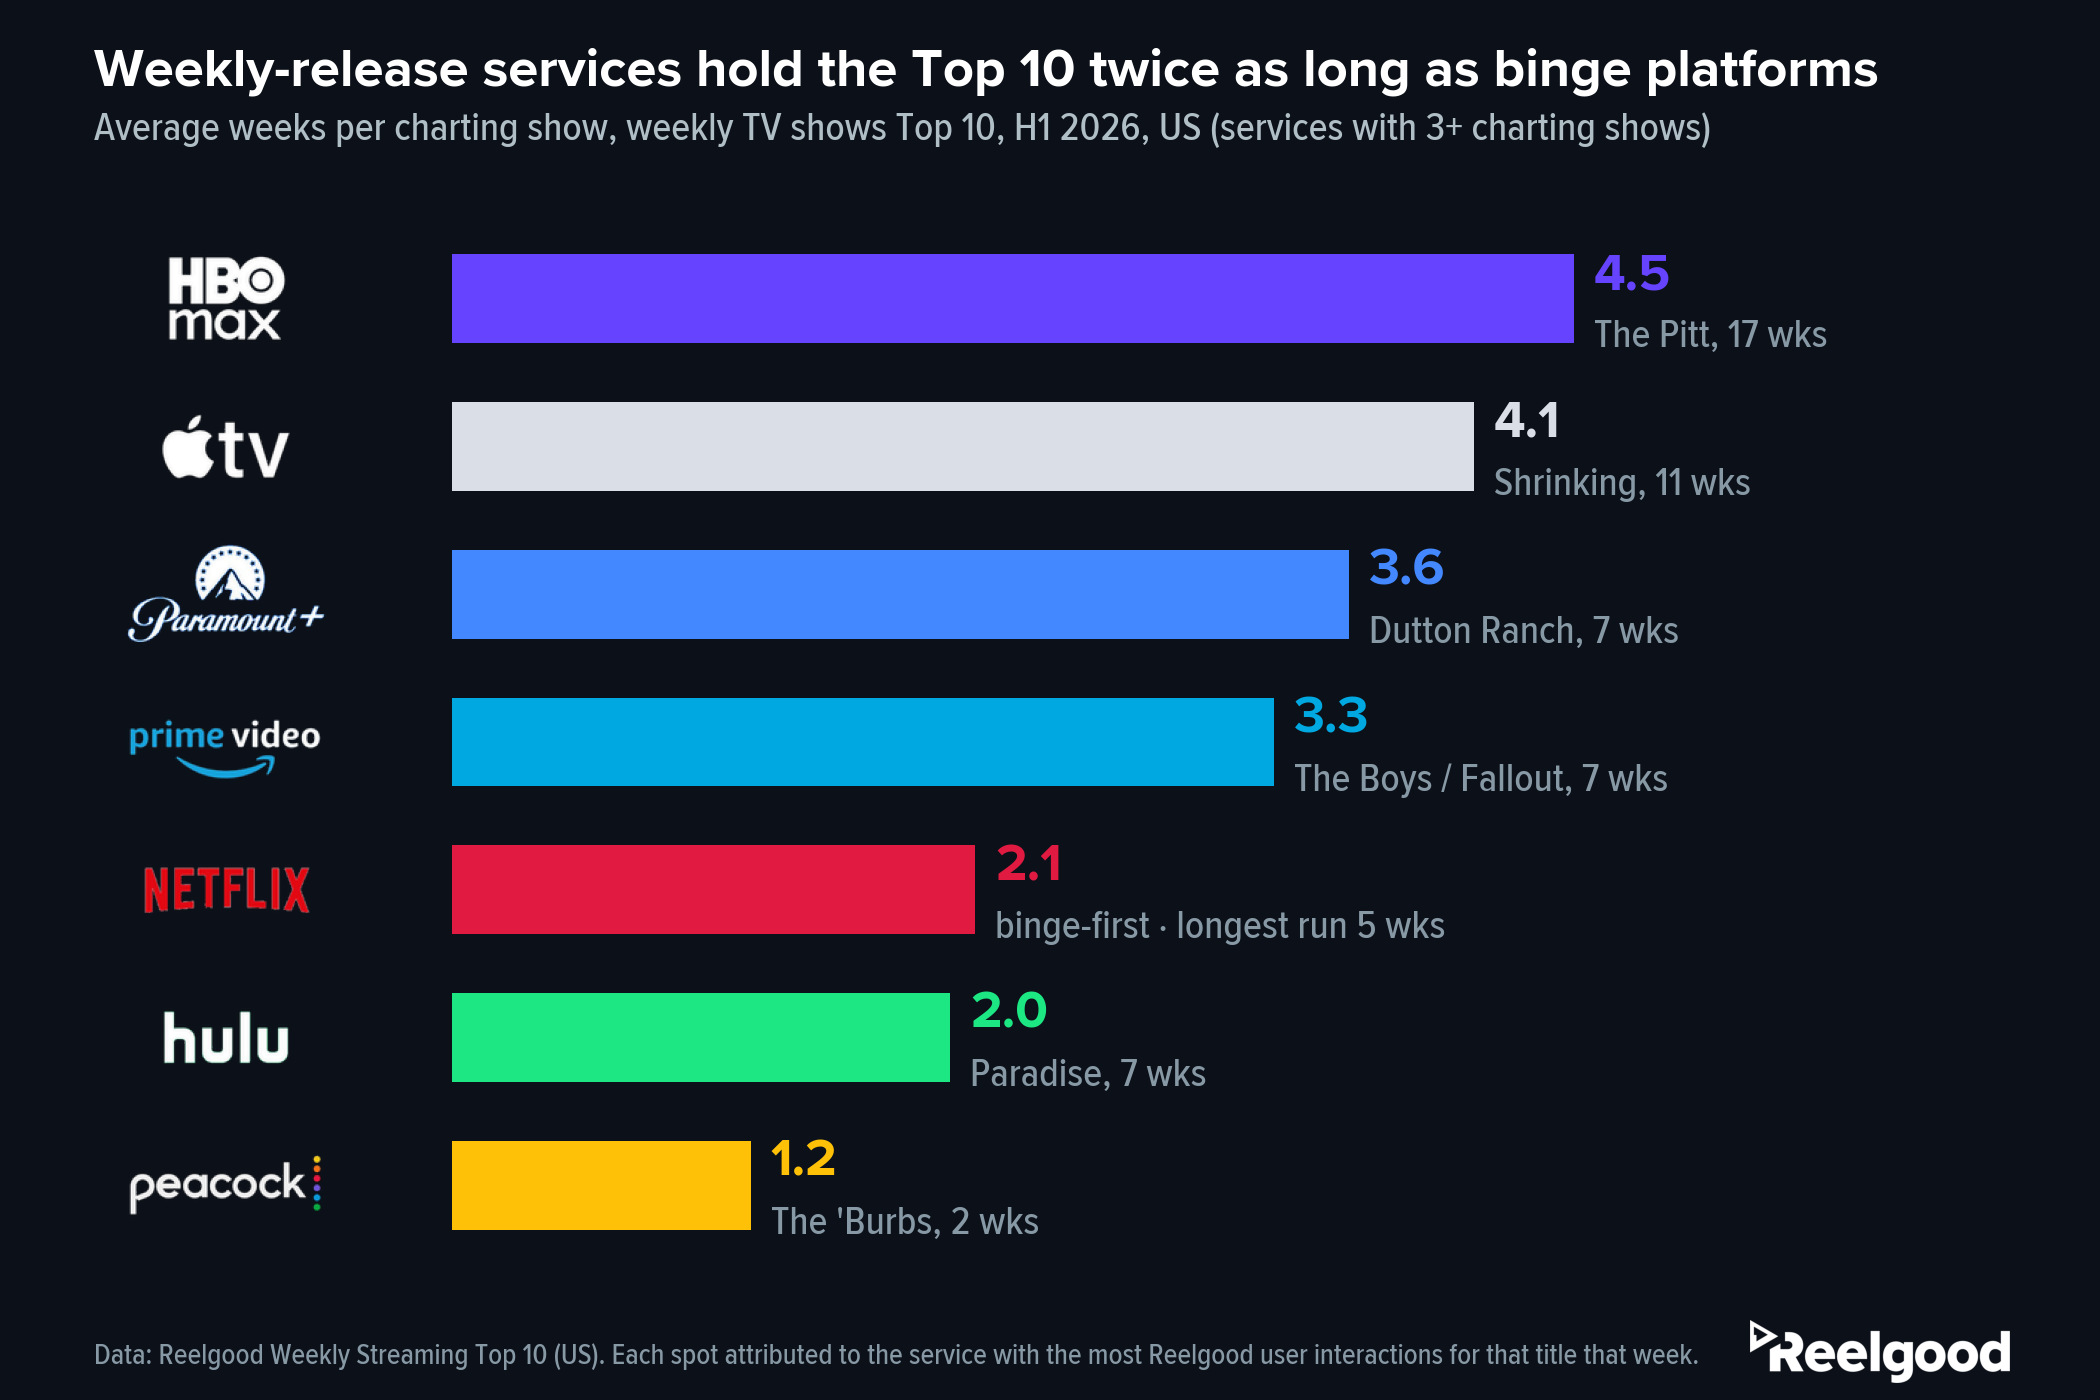
HBO Max and Apple TV shows averaged over 4 weeks on the TV Top 10 in H1 2026; Netflix’s averaged 2.1 with a 5-week ceiling. Data: Reelgood Weekly Streaming Top 10 (US).
Staying Power on the TV Top 10 Splits by Release Model
Rank the services by how long their shows hold a chart spot and the release philosophies sort themselves:
| Service (H1 2026, shows list) | Shows charted | Avg weeks per show | Longest run |
|---|---|---|---|
| HBO Max | 11 | 4.5 | 17 (The Pitt) |
| Apple TV | 11 | 4.1 | 11 (Shrinking) |
| Paramount+ | 5 | 3.6 | 7 (Dutton Ranch) |
| Prime Video | 15 | 3.3 | 7 (The Boys, Fallout) |
| Netflix | 27 | 2.1 | 5 (His & Hers, The Boroughs) |
| Hulu | 10 | 2.0 | 7 (Paradise) |
| Peacock | 5 | 1.2 | 2 (The ‘Burbs) |
The top of the table is the weekly-episode economy, and Netflix, the definitional binge service, charts the most shows and holds them the shortest. Hulu and Peacock complicate the picture usefully: both lean weekly, and both sit low. That’s the control group. A weekly calendar extends a hit’s run; it doesn’t manufacture the hit. (Hulu’s one long run, Paradise at 7 weeks, was a weekly release.)
The pattern isn’t a 2026 quirk. The same split ran through H1 2025: HBO Max averaged 6.1 weeks (led by The Pitt‘s first season at 16), Apple TV 4.7 (Severance, 13), and Netflix 2.6, with the same 5-week ceiling.
Weekly Shows Chart Like Their Release Calendars, Then Outlast Them
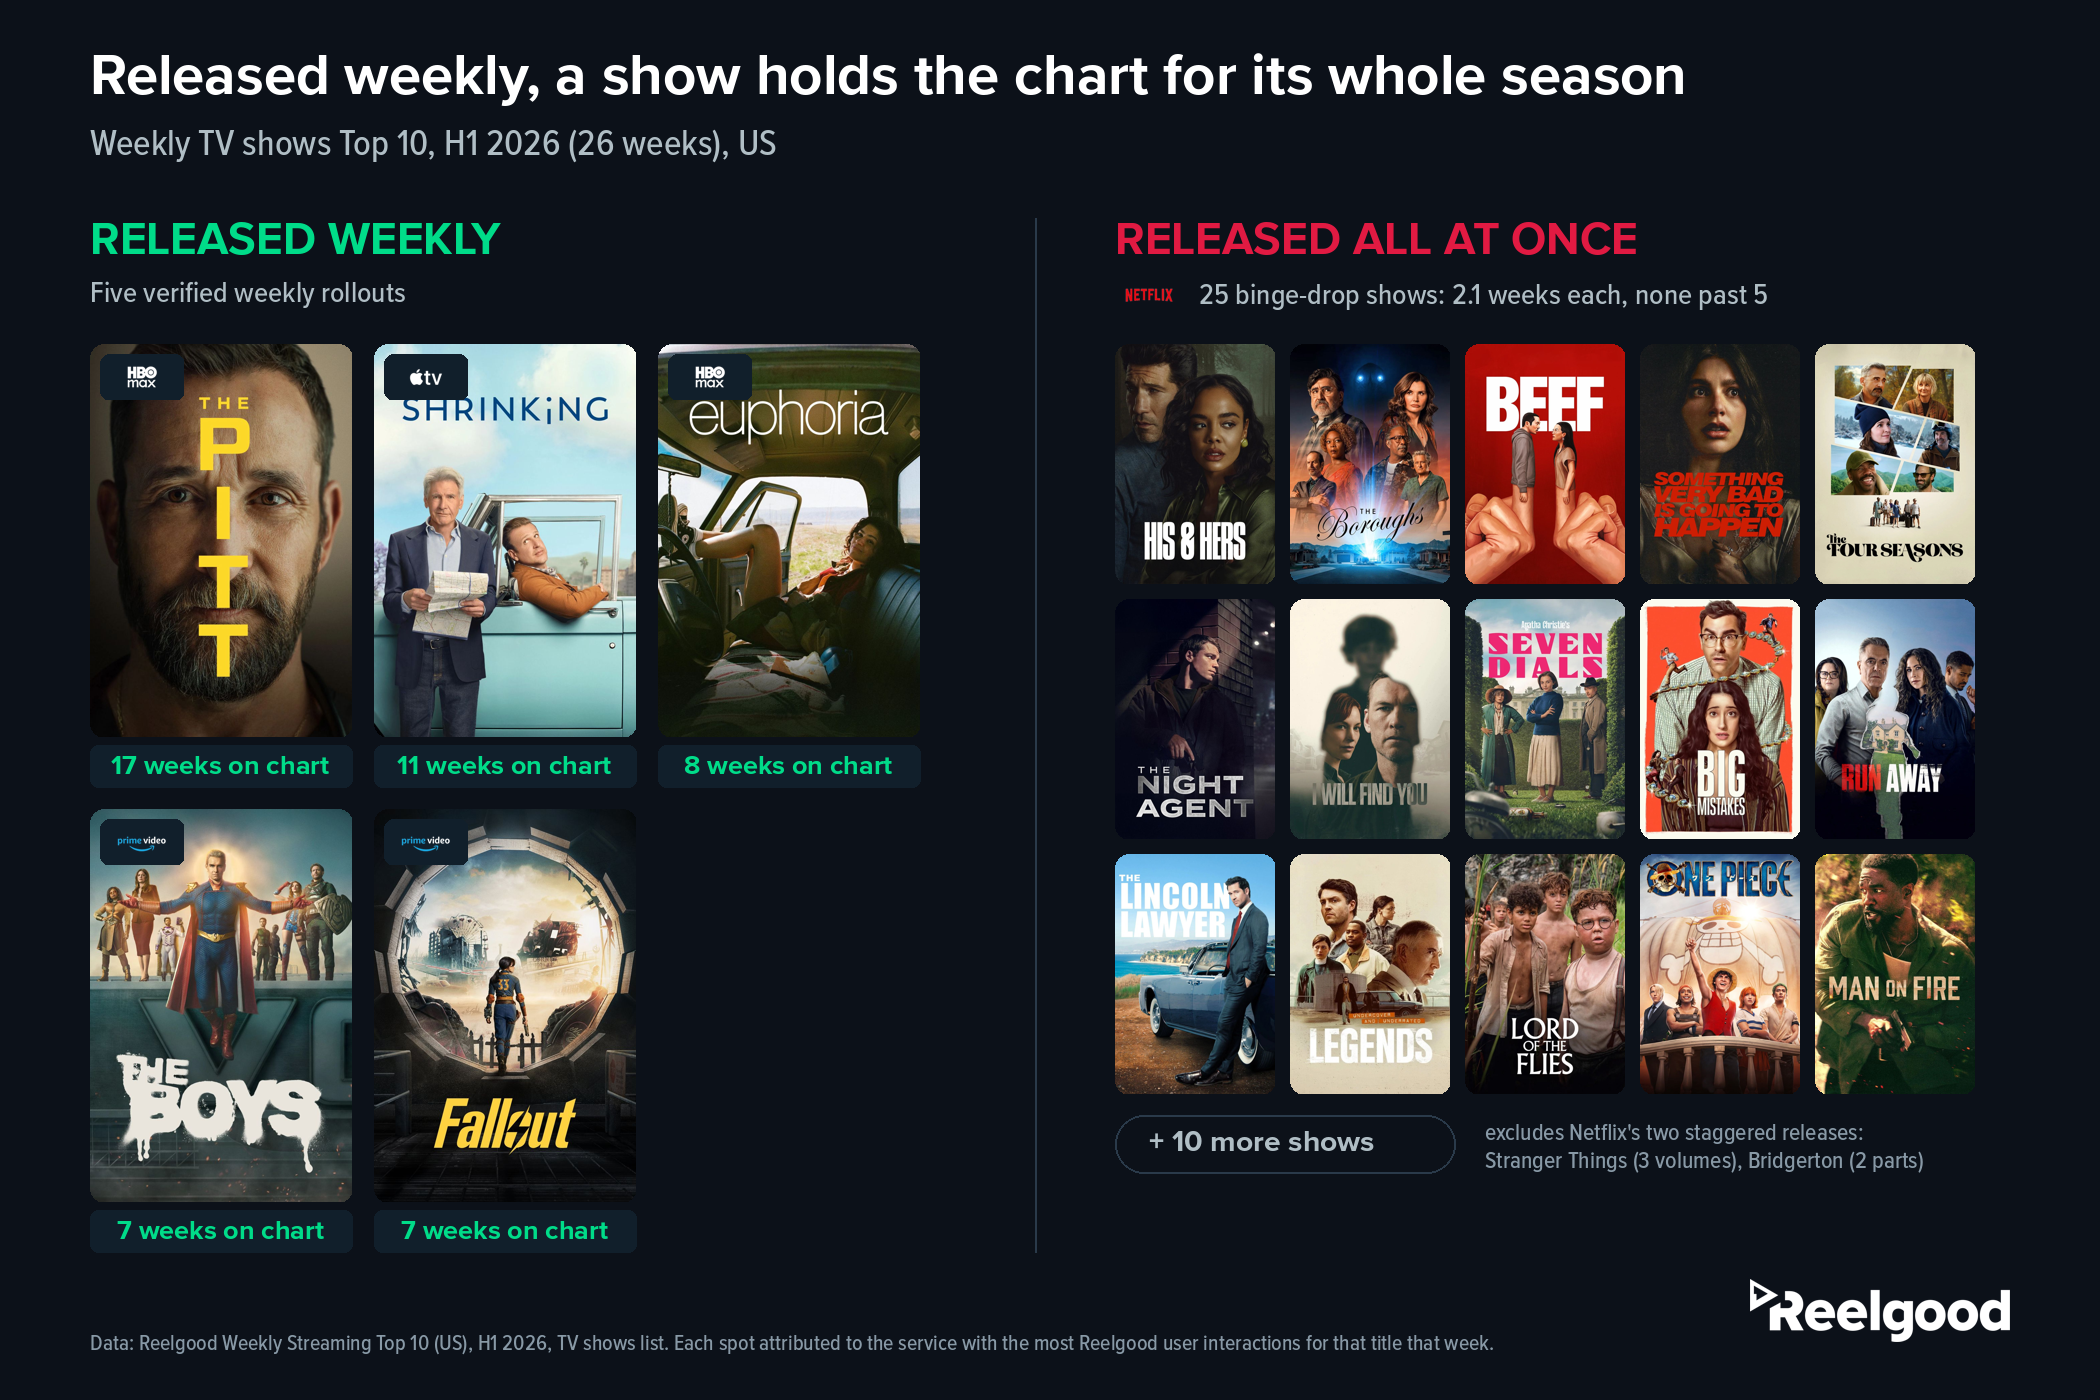
H1 2026’s five verified weekly rollouts charted for 7 to 17 weeks each; Netflix’s 25 binge-drop shows averaged 2.1. Data: Reelgood Weekly Streaming Top 10 (US), TV shows list.
Put a show’s chart run next to its episode schedule and the two move together.
The Pitt‘s second season ran 15 weekly episodes from January 8 to April 16; it held a shows-list spot for 17 straight weeks. Shrinking‘s 11 weekly episodes produced an 11-week run. Euphoria‘s eight Sunday episodes, an 8-week run. The Boys‘ final season rolled out weekly from April 8 to May 20; 7 weeks on the chart. Fallout‘s second season went weekly from mid-December through February 4; 7 weeks.
A skeptic could call that mechanical: release across 15 weeks and you get 15 weeks of activity by construction, the same demand sliced thinner. The data pushes back twice.
All three verified weekly rollouts kept charting past their finales, The Pitt and Fallout by two weeks and The Boys by one, attention the calendar no longer explains.
And the runs weren’t clinging to the bottom of the chart: The Pitt spent 12 of its 17 weeks in the top 3, averaging rank 3.2. Every new episode is a fresh spike of audience interaction, and each week it earns is another week the title sits in front of deciding viewers.
The Binge Pattern: A Big Week One, Then Gone
Netflix’s model produces the opposite shape. An all-at-once season concentrates its entire audience into one or two chart weeks; there’s no episode two to bring viewers back next Thursday.
So the service with the most charting shows, nearly double any rival’s, also has the shortest runs, and nearly a third of its titles charted exactly once.
Its exceptions point the same direction, with a caveat.
Across the full 18 months, only three Netflix shows ran 7 weeks or longer, and two are the ones where Netflix staggered its own release: Stranger Things‘ final season, split into three volumes, charted 8 weeks, and Wednesday, split into two parts a month apart, charted 7. That’s consistent with staggering extending runs, though these are also Netflix’s two biggest franchises, so title strength and cadence are entangled.
And staggering guarantees nothing: Bridgerton‘s fourth season, also split into two parts, charted just 3 weeks. The lone conventional binge drop to go long was The Beast in Me, all eight episodes at once, 7 weeks: proof it can happen, and a measure of how rarely it does.
Two honest caveats belong here. First, service is a proxy for release model, and the biggest weekly shows are also their services’ biggest bets, so cadence and flagship marketing are entangled on both sides of the comparison.
Second, chart tenure is one measurement with real limits. It tracks how long a title keeps commanding attention in the market, week over week. It says nothing about completion rates or total hours viewed, the numbers binge advocates rightly point to.
Both things can be true: a binge drop can win on hours while a weekly release wins on weeks in the conversation.
What Programming and Marketing Teams Can Do With This
- For programming and scheduling teams, the tenure gap makes release cadence a strategy decision as much as an operations one. The same season, staggered, buys weeks of chart presence that a binge drop trades for one big spike; Netflix’s own volume and split experiments show the lever works even inside a binge-first culture.
- For marketing teams, tenure defines the conversion window. A binge hit’s attention is measured in days, so campaigns, partnerships, and win-back offers tied to it have roughly two weeks to land. A weekly hit like The Pitt holds attention for a full quarter, which is a different campaign calendar entirely.
Neither judgment is possible from a screenshot of one week’s chart. It takes the week-by-week history: when each title entered, how long it held, where it ranked, and how its run maps to its release schedule. Request a sample of the weekly rankings history with full metadata at data@reelgood.com.
Data: Reelgood Movie & TV Metadata & Streaming Availability Database and Reelgood Weekly Streaming Top 10 (US), January 2025 through June 2026 (full-dataset claims cover all 79 tracked weeks through early July 2026). Analysis covers the weekly TV shows Top 10 list, its own list of 10 spots per week (260 per half-year period). Each spot is attributed to the service that received the highest number of Reelgood user interactions for that title in that week; interactions are users’ real-time, organic engagements with titles on Reelgood, with promoted activity excluded, and attribution does not imply exclusivity. SVOD/AVOD titles only. Service is used as a proxy for release model; individual title cadences cited are externally sourced.