Every Streaming Service Has a Fingerprint. Do You Know Yours?
A streaming platform we work with spent months struggling to explain what made its service different. The marketing team had theories. None of them stuck. Then it ran its catalog through Reelgood’s data and found something it had never noticed: it held the largest horror library of any major streamer. Nobody internally had framed the service that way. Within weeks, that single fact became the spine of its marketing for the year.
That is what catalog data does when you actually look at it. It tells you what your service is, not what you assume it is.
And when you measure genre composition across the market, a clear pattern emerges: every platform has a distinct fingerprint. The mid-tier services often have the sharpest ones.
Knowing your own fingerprint and your competitors’ is how a marketing team finds the white space. It is also how a licensing or acquisition team works: the same fingerprint that tells a marketer where to position, tells a buyer which catalogs to license from, and a seller which services to pitch.
Reading the catalog is the first move in both jobs.
Key Takeaways
- Every streaming catalog has a measurable genre identity. Most teams describe their service the way they intend it to be, not the way the data reads.
- Over the past 12 months, platforms have been actively reshaping their catalogs. Prime Video expanded across every genre, led by Biography up 43.2%, while Netflix quietly trimmed its International catalog by 11%.
- Mid-tier services like BritBox, AMC+, Howdy, and MGM+ carry sharper, more differentiated identities than most of the Top 8, across both genre and TV-versus-movie mix.
- The genres shown here are a small subset of the full taxonomy. Reelgood tracks 50+ genres and 250+ tags, so the same approach supports a much more detailed analysis of any service, cut across genres, sub-genres, time periods, and geographies.
What Each Streaming Catalog Is Becoming
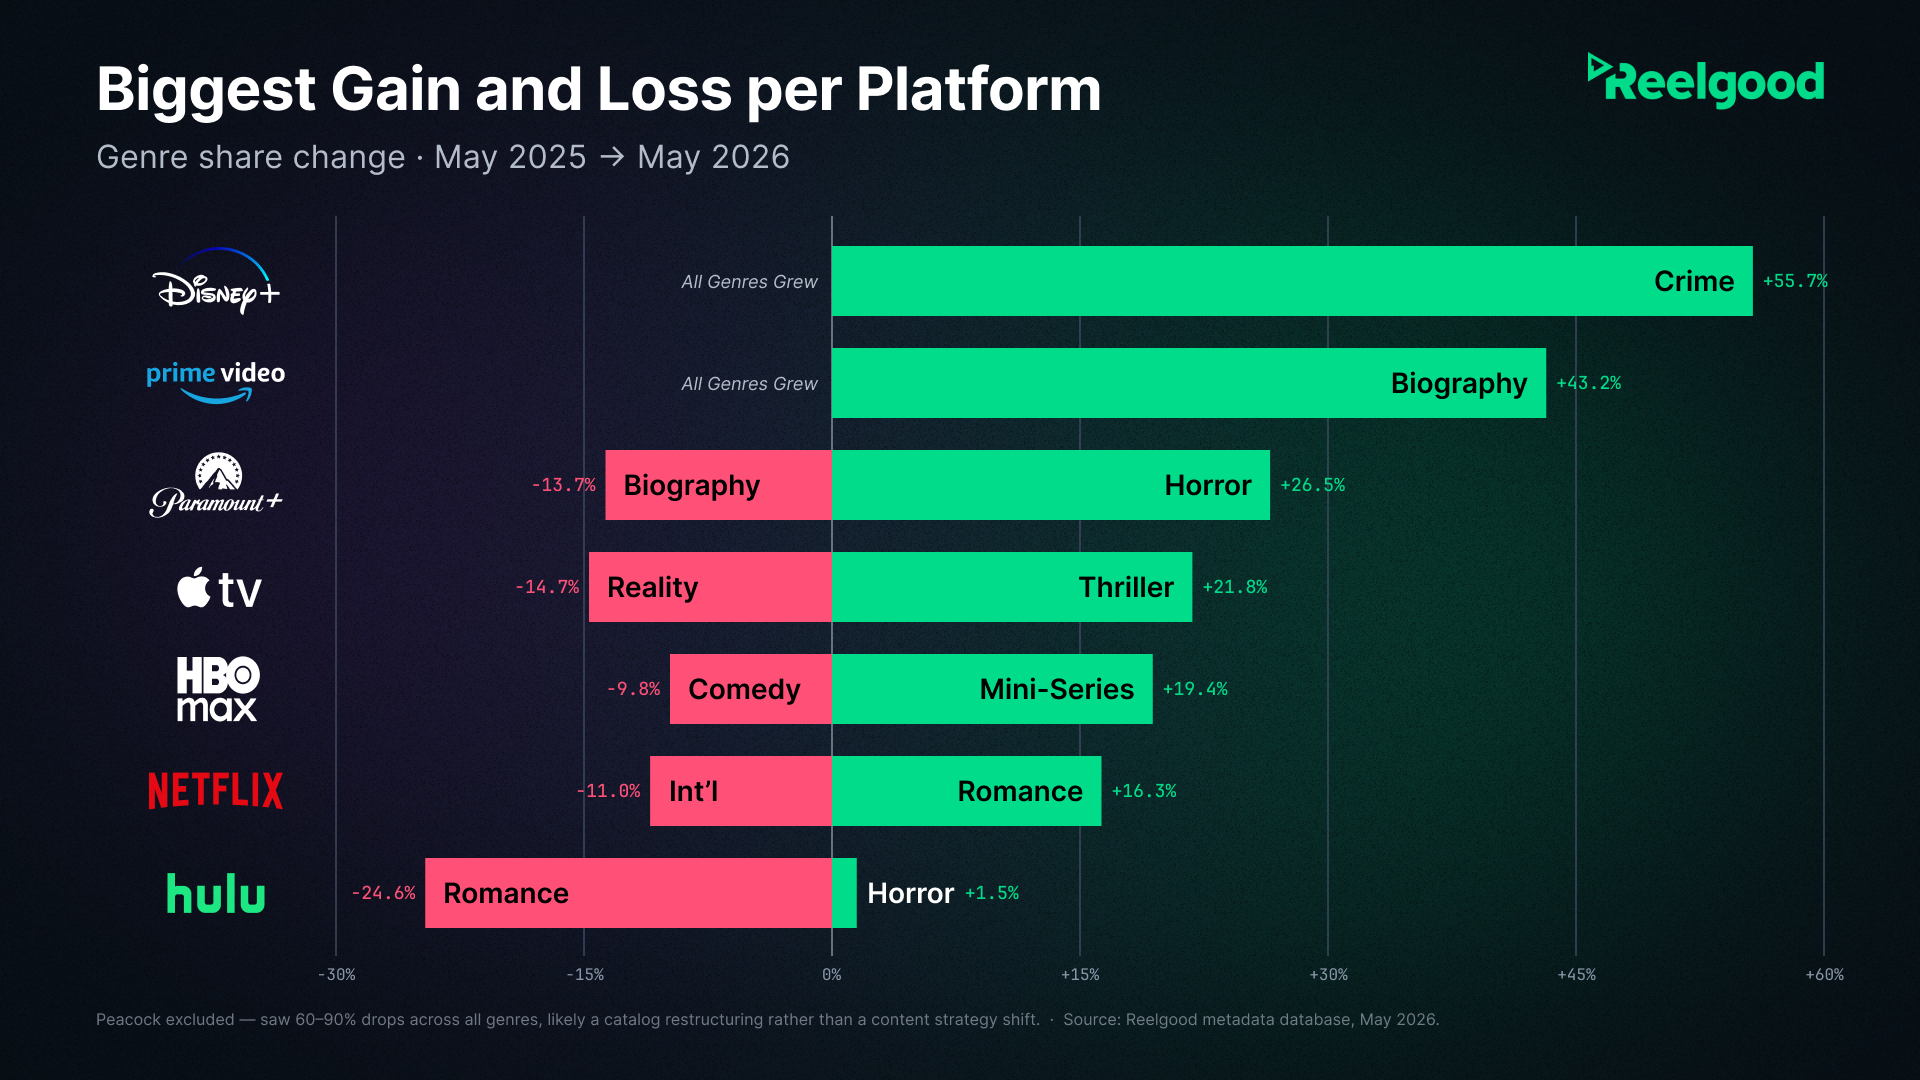
Every platform is actively reshaping its catalog, and the direction of those bets is visible in the data. Looking at the biggest genre gain and loss per platform over the past 12 months tells you
what each service is building toward, and what it is stepping back from.
For example, Disney+ and Prime Video grew across the board, with every genre expanding. On Prime Video, Biography was the single biggest gainer, up 43.2%. Netflix went the other way.
Other genre-level splits matter too: Biography is shrinking on Paramount+, while Horror showed real room to grow there and stayed thin on Hulu.
None of this is abstract trend-watching. If you run marketing, licensing, or acquisition at any of these platforms, or you sell to them, the direction of catalog change tells you where the demand and the gaps are.
As we covered in our Streaming Iceberg analysis, the catalog you can see is only a fraction of the market. The catalog that is moving is where the strategy lives.
Every Streaming Service Has a Genre Fingerprint
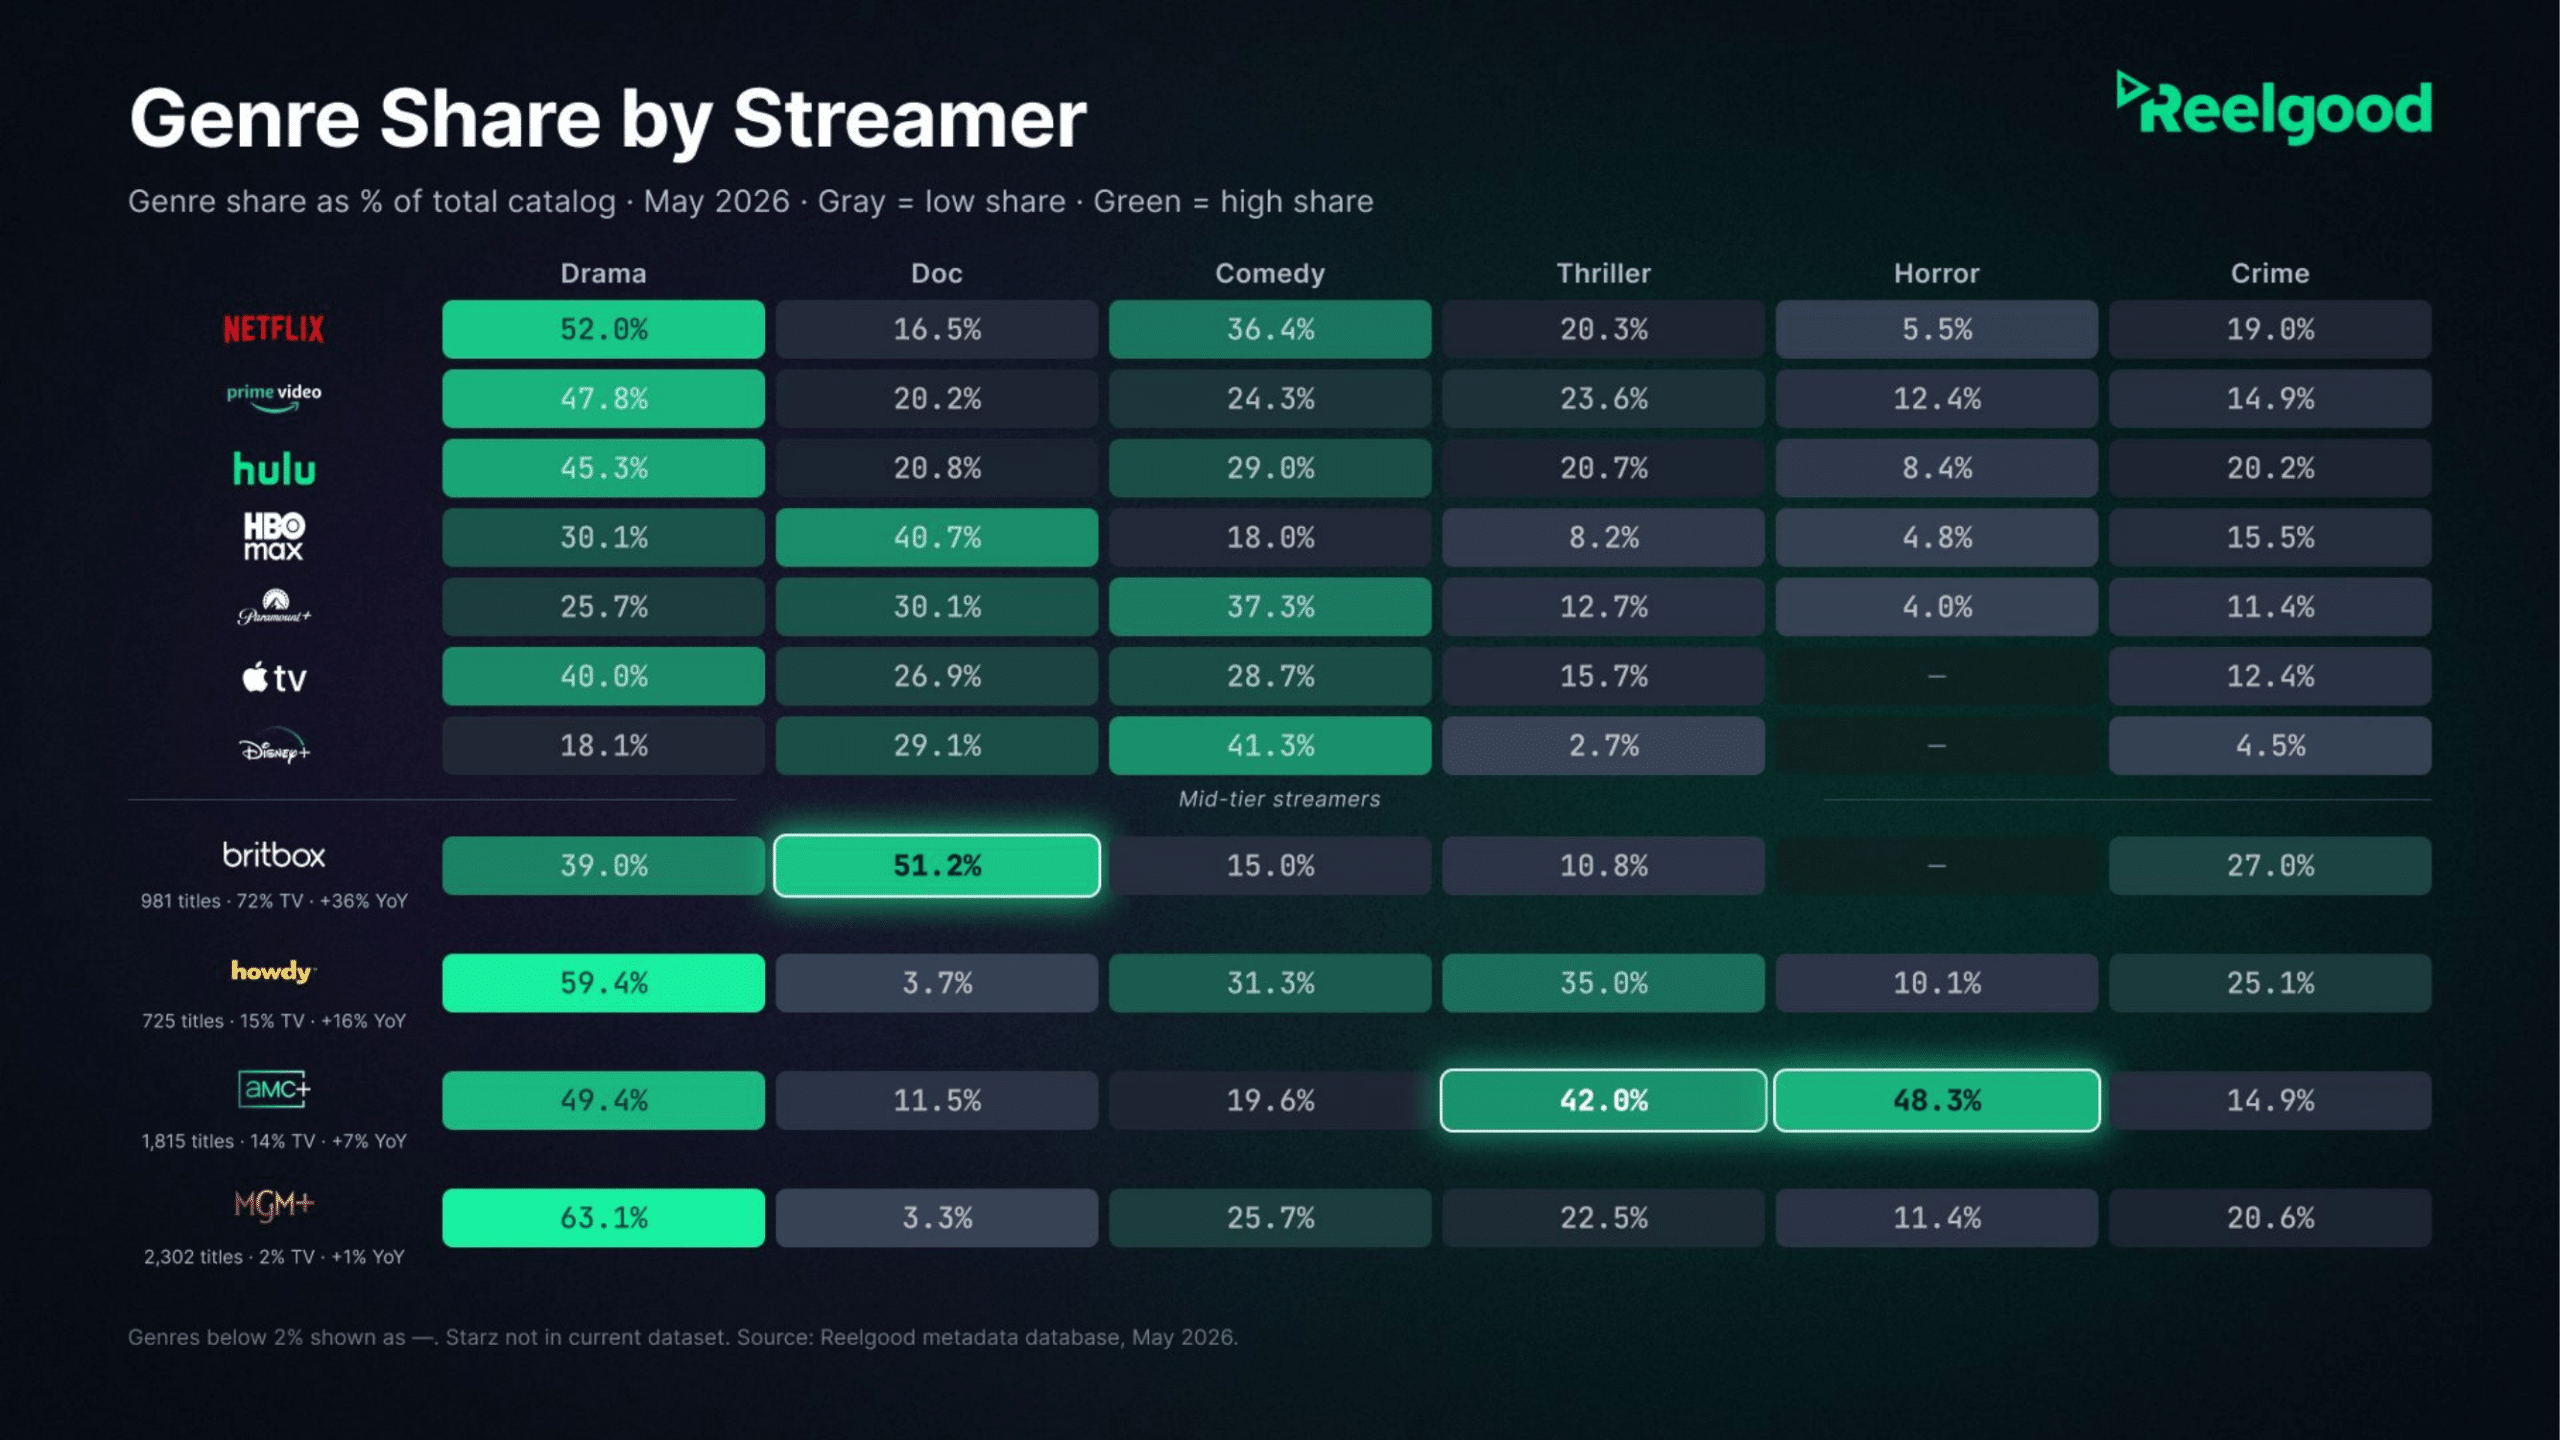
Forget what changed for a moment. Here is what each platform is today, measured as genre share of total catalog.
A few things stand out at the top tier. HBO Max leads the majors on Documentary at over 40%, with no other Top 8 platform close. Disney+ runs a completely different philosophy, with Comedy at 41% and Family at 52%. Paramount+ leads with Comedy and carries a deep legacy library behind it, a pattern consistent with what we found in our catalog depth analysis.
Then look at the mid-tier, where the identities get even sharper.
BritBox sits at 51% Documentary and 39% Drama, a distinct identity built around British content. That figure is worth pausing on: HBO Max leads the majors on Documentary, but mid-tier BritBox actually tops it. AMC+ is the only service in the dataset where Horror nearly rivals Drama in share. Howdy leans hard into Drama and Thriller, with 85% of its catalog in movies.
The implication for a marketing team is direct. A sharp content identity is an advantage, but only if you know you have it.
The mid-tier platforms often have a clearer story to tell than the household names, because their catalogs are concentrated rather than sprawling.
Mid-Tier Streamers Often Have the Sharpest Identities
A lot of people building, selling to, or competing with streaming services work in the mid-tier, so it is worth looking at a few specifically.
The four below are a small sample, not the full field: there are dozens of mid-tier and niche services, and each one rewards the same scrutiny. Each is a niche done deliberately, and the differences show up in both genre and format.
- BritBox carries 981 titles, 72% of them TV, growing 36% year over year around a very specific audience.
- Howdy runs 725 titles, 85% movies, up 16%, with Drama and Thriller dominant.
- AMC+ holds 1,815 titles with Horror at 48%, the clearest single-genre identity in the mid-tier.
- MGM+ is a 2,300-title classic film vault, 98% movies, with deep western and genre depth and flat growth.
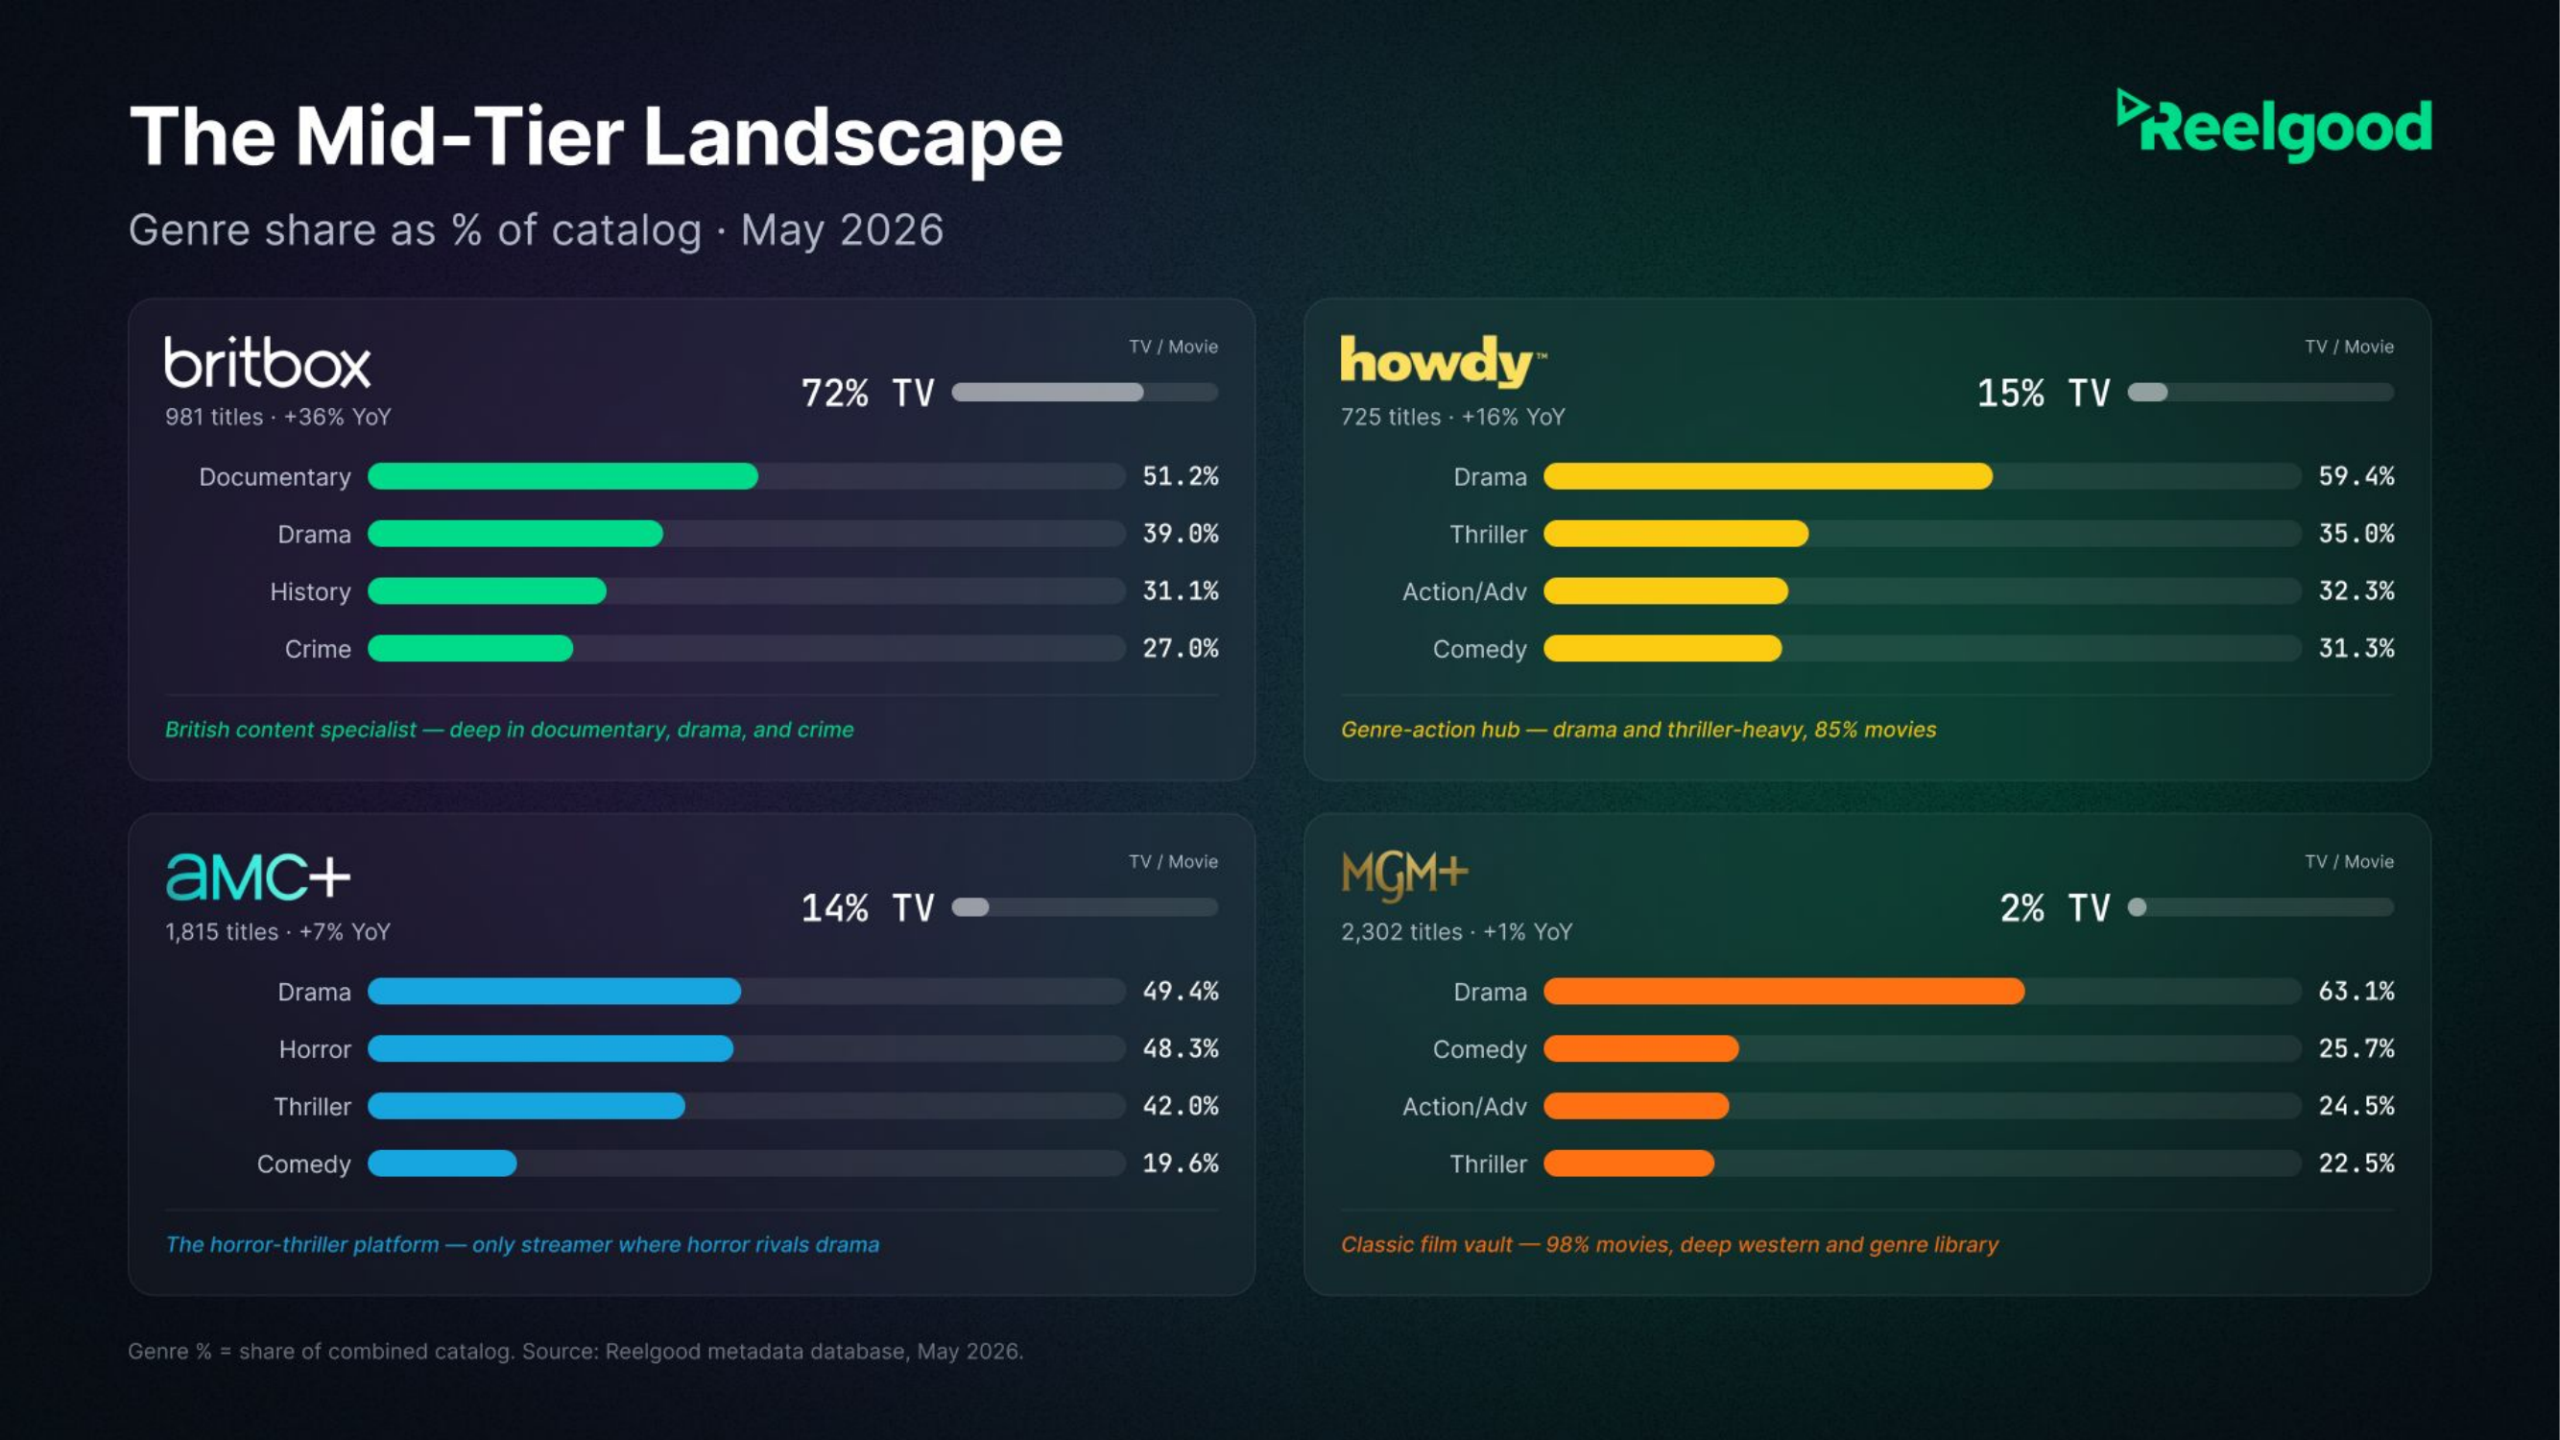
Notice that the TV-versus-movie split is its own axis of differentiation.
BritBox is a TV-first service. Howdy and MGM+ are almost entirely movies. That distinction matters as much as genre when you are positioning a service or deciding where a title belongs.
For content licensing and acquisition teams, this is the targeting map. If you have a western or a genre film to place, MGM+ is the obvious conversation. British-leaning drama fits BritBox. Horror has room at both Paramount+ and AMC+. You are not pitching blind. You are matching content to a measurable gap in a specific catalog, the same competitive-catalog logic behind our look at which streamers share the most and least content.
The same logic runs in reverse for content owners. A content strategy and acquisitions lead at a production studio told us they model which buyers in which markets still acquire which genres before greenlighting anything:
“Is that key player in Sweden buying US or Canadian drama anymore? If they are, what kind?”
The fingerprint of a buyer’s catalog tells a seller where a title is most likely to land, and at what kind of price.
Availability history adds one more layer to that judgment. An executive building a new platform and licensing library content put it bluntly:
“If something is overexposed, then it’s not as valuable.”
A title that has already run free across half a dozen services is a different asset than one that has been dark for two years, even if the two look identical in a catalog list. Where a title has been, and whether it is currently dark, is part of its fingerprint too.
Genre Share Is Only the Surface
Everything above uses six broad genres. That is the surface.
Reelgood tracks more than 50 genres and 250 tags and sub-genres, which means the same analysis can get far more specific than “Documentary” or “Crime.”
You can see exactly which sub-genres are rising or falling inside a given catalog, and you can cut the view across services, time periods, and geographies. The genre fingerprint is a starting point, not the whole picture.
Finding the White Space in Streaming
Know your strengths, know your competitors’ strengths, and the open space becomes visible. That is the entire exercise. The platforms that win the positioning battle are the ones that see their own identity clearly and spot where rivals are exposed before the rivals do.
This is the gap most teams still live with. A global research lead at a major studio described it to us plainly:
“We know what we’re doing, but we don’t know what the others are doing.”
Their own windowing data arrived as a single spreadsheet once a month, which made competitor moves nearly impossible to track in time to act on them. You cannot find the white space when you can only see half the board.
If you want to see what this looks like for your own service or your competitors’:
- Marketing and brand teams: Request a genre-share view of your catalog against your closest competitors to find the story your data already supports. See the streaming data use cases.
- Content licensing and acquisition teams: Ask for a catalog-gap and historical-availability view to see which platforms fit the titles you are placing or acquiring, and which titles are fresh versus overexposed.
Reach out at sales@reelgood.com or request access through our data request form.
Data: Reelgood Movie & TV Metadata & Streaming Availability Database, June 2026. Genre share calculated as a percent of each platform’s total catalog. Top 8 defined as Amazon Prime Video, Disney+, HBO Max, Hulu, Netflix, Paramount+, Peacock, and Apple TV.