What a Genre Dashboard Can’t See: The Case for Tag-Level Demand Data
Genre data says streaming barely changed this year: Drama held 167 of 260 weekly Top 10 spots in H1 2025 and 168 in H1 2026. But look closer – tag (sub-genre) data shows 82% of the stories behind that number turned over.
Between the first half of 2025 and the first half of 2026, US streaming audiences abandoned political thrillers, embraced relationship and small-town stories, and cut TV thrillers’ chart presence in half.
A demand report built on genre registered almost none of it. That matters because most content and catalog analysis across the industry still runs at the genre level, and this year is a case study in what that broad view conceals.
The numbers come from Reelgood’s weekly Streaming Top 10, which ranks the most-streamed movies and shows in the US each week based on the real viewing behavior of Reelgood users across every major service.
In three earlier posts we documented the decline of political stories, the personal-stories surge, and the TV thriller correction. This post quantifies why
Most of those findings are invisible to a taxonomy that stops at genre.
A note on terms: tags are Reelgood’s sub-genre descriptors. Where genre says Drama, tags say medical, small-town, or political.
Key Takeaways
- Compare H1 2026’s Top 10 against H1 2025’s at the genre level and 23.6% of the chart’s makeup changed. Run the same comparison at the tag (sub-genre) level and 66.3% changed: nearly three times the movement, in the same titles, over the same weeks.
- Within the Drama genre specifically, 82.3% of the tag makeup changed while Drama’s own count barely moved, from 167 of 260 spots to 168.
- The titles in this dataset carry 224 distinct tags but only 40 genres, averaging 5.7 tags and 3.3 genres per title. The signal lives in the layer with more resolution.
- Every actionable finding in this series (specifically, which themes to license toward, which shelves to promote, which format’s thrillers are correcting) exists at the tag level or below.
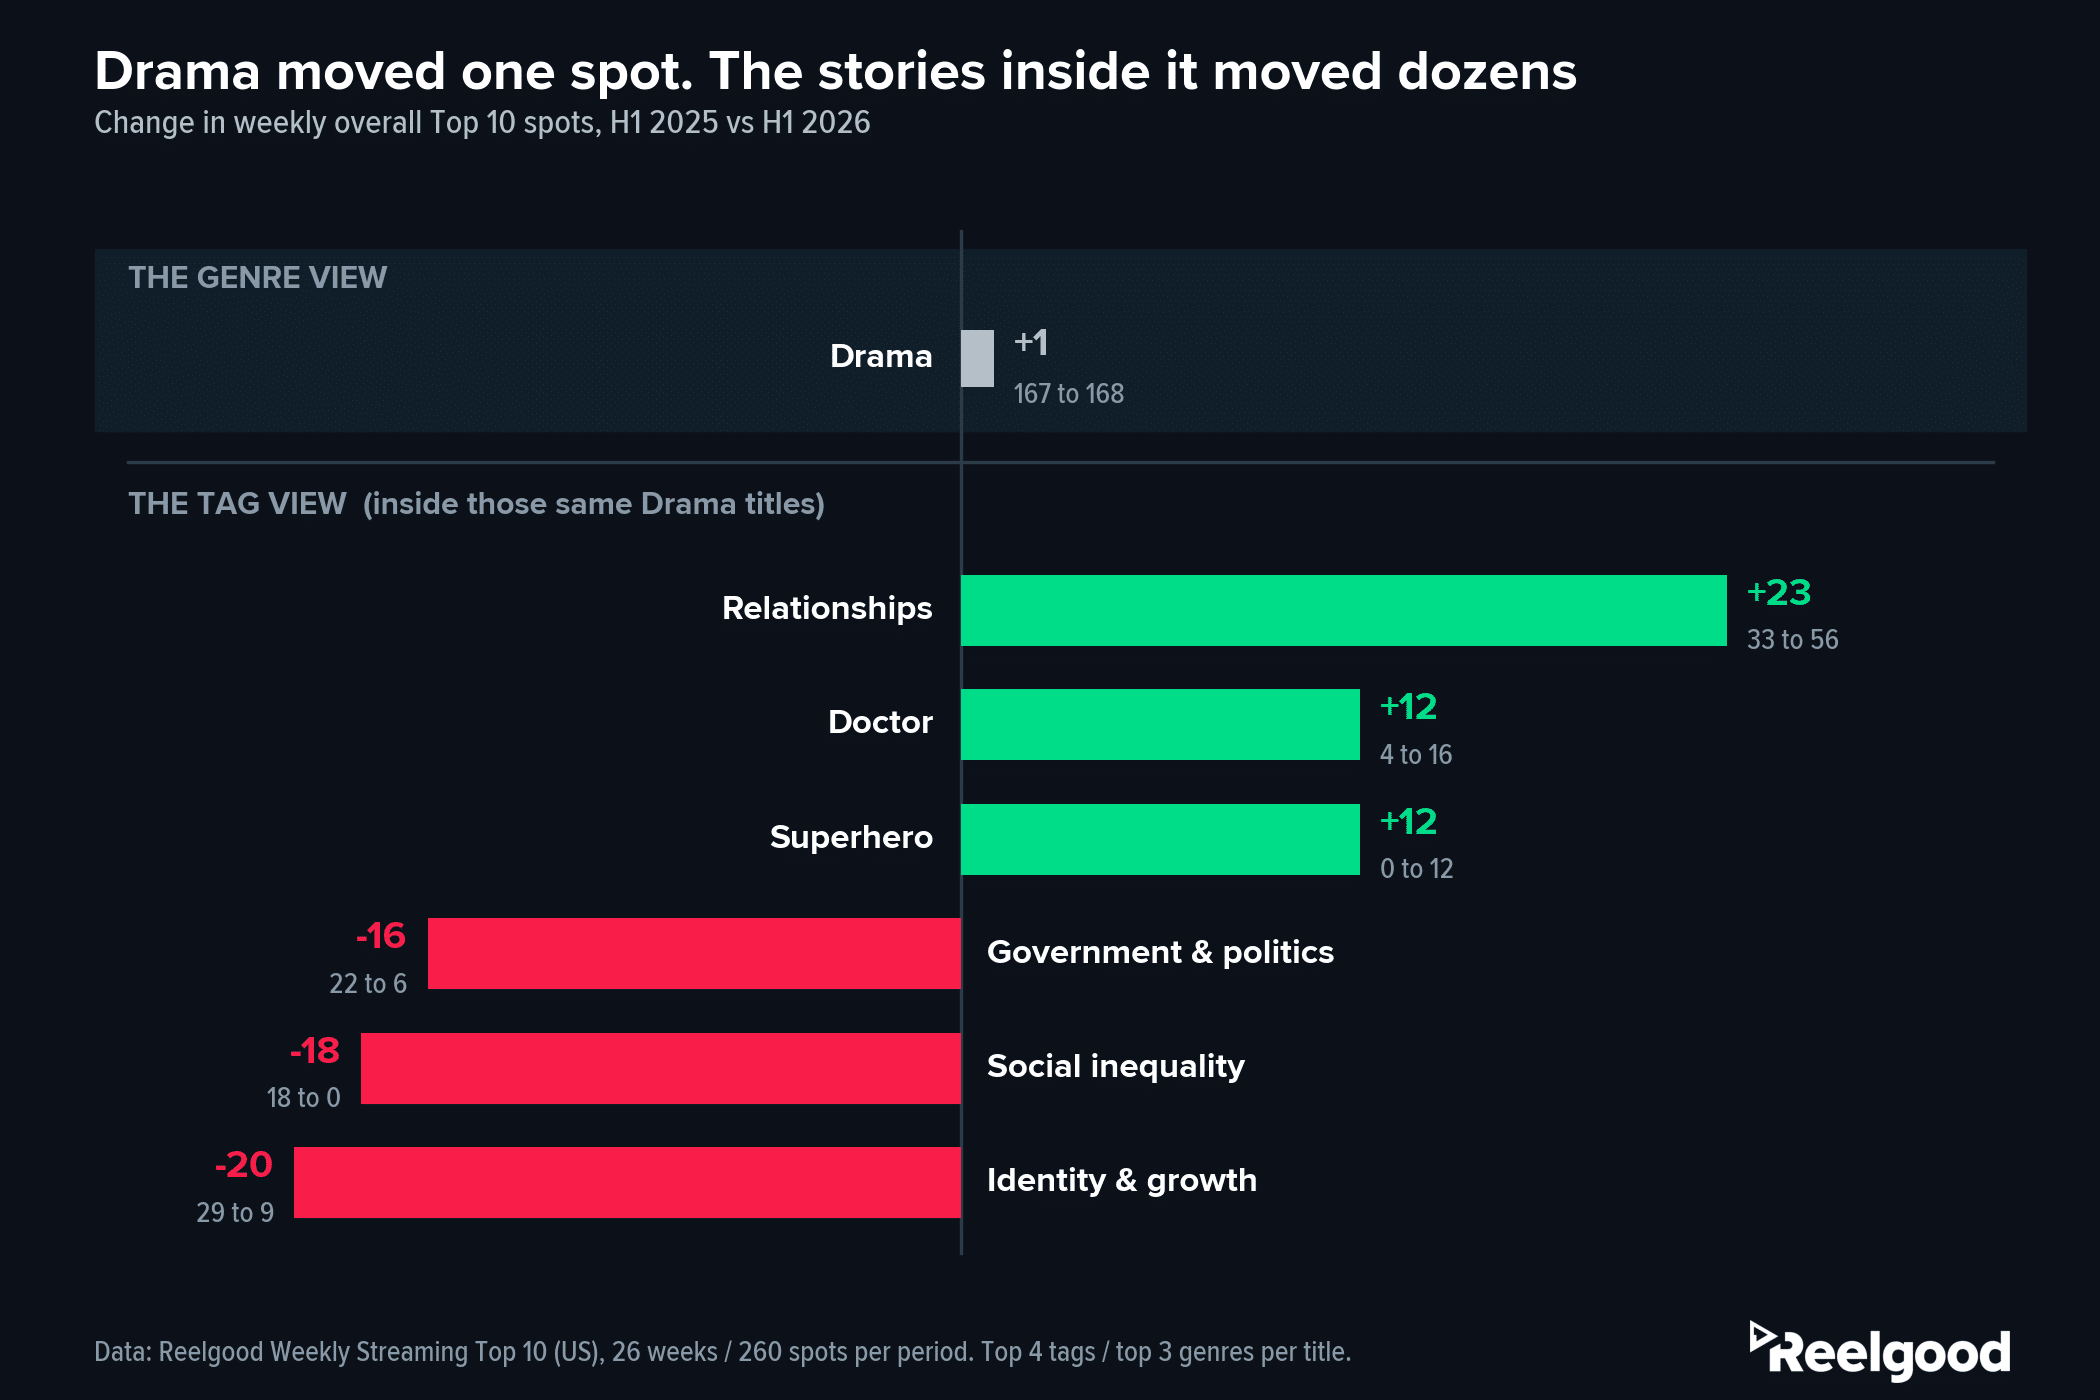
Drama’s genre count moved one spot between H1 2025 and H1 2026 while the tags inside it turned over 82%. Data: Reelgood Weekly Streaming Top 10 (US).
Genre Data Showed a Flat Line. Tag Data Showed a Different Cast of Stories
Drama is streaming’s constant: roughly two-thirds of overall Top 10 spots in both periods, a change of one spot year over year. A genre dashboard renders that as stability.
Here’s what actually happened inside Drama-tagged titles:
| Within Drama | H1 2025 | H1 2026 |
|---|---|---|
| Relationships | 33 spots (17 titles) | 56 spots (22 titles) |
| Doctor | 4 spots (1 title) | 16 spots (2 titles) |
| Superhero | 0 | 12 spots (3 titles) |
| Government & politics | 22 spots (7 titles) | 6 spots (4 titles) |
| Identity & growth | 29 spots (8 titles) | 9 spots (5 titles) |
| Social inequality | 18 spots (4 titles) | 0 |
The title counts show which moves are broad and which are concentrated.
The relationships tag charted through 22 different shows and films in H1 2026, up from 17 the year before: a broad, genuine demand shift. The doctor tag’s jump comes from just two shows, The Pitt and Scarpetta, and superhero’s from three (The Boys, Spider-Noir, Wonder Man): real gains, but narrow ones.
Telling the difference between a trend and a couple of hits is exactly what the tag data is for.
Same genre, same chart, same number of spots. A different set of stories. Measured across all tags, 82.3% of Drama’s internal makeup changed while its genre line moved 0.6%.
Why Tag-Level Data Catches Demand Shifts Genre Data Misses
Here’s the measurement behind those percentages.
Take each genre’s count of Top 10 spots in H1 2025, compare it with H1 2026, and add up all the differences: by that yardstick, 23.6% of the chart’s genre makeup changed year over year. Run the identical calculation on tags and 66.3% changed. Nearly three times the movement, for a simple reason: 224 distinct tags describe these titles, against 40 genres, so change has somewhere to show up.
And the movement wasn’t noise scattered across a fine taxonomy. It was one coherent trade: political and social-issue stories gave up spots, and relationship, medical, and superhero stories absorbed them.
The TV thriller correction showed this in miniature, where one blended Thriller number hid a collapse on TV and stability in film. This is the full accounting, and the stakes are practical: whether your data registers a shift before your competitors’ programming decisions make it obvious.
The rotation away from political stories was visible in tag data as it happened. In genre data there was nothing to see.
Most teams are still looking at the genre view.
What Genre-Only Analysis Costs Teams, and What to Do Instead
- Licensing: an analyst valuing a drama package sees one number, “drama: stable,” while the themes inside diverged sharply. Within Drama, political stories fell from 22 spots to 6 and social-inequality stories from 18 to zero, while relationship stories rose from 33 to 56. Genre data prices packages built on those themes identically.
Instead: score each package’s titles against current tag-level demand, so the price reflects where the audience is heading rather than the category label.
- Programming: a strategist pitching “more drama” is pitching a category whose winning composition just inverted.
Instead: pitch and greenlight at the sub-genre level, backing the kinds of drama gaining spots (relationship, medical, small-town) over the kinds fading away.
- Discovery: a genre-built drama row can’t isolate the subset holding the demand momentum, so the shelf that should feature relationship and small-town stories surfaces last year’s political titles alongside them.
Instead: build rows from demand-weighted tags, so the shelves follow the audience instead of trailing it.
The common thread: make tag-level demand a standing input to the decision, not a one-off study.
The shift documented in this series took twelve months; teams reviewing thematic demand quarterly would have caught it mid-move, while their genre dashboards were still reporting a flat line.
Reelgood’s Taxonomy: 50+ Genres, 250+ Tags Across Six Dimensions
Reelgood’s expanded content taxonomy classifies titles with 50+ genres and 250+ tags organized across six dimensions, priority-ordered and applied consistently to 4M+ titles across 300+ streaming services globally, updated continuously; the same structure that powers this analysis. (The Top 10’s charting titles drew on 224 of those tags.) It’s the difference between reporting that drama is stable and knowing which drama to buy.
Request a sample of the weekly rankings history with full metadata, or a walkthrough of the full metadata dictionary, at sales@reelgood.com.
Data: Reelgood Movie & TV Metadata & Streaming Availability Database and Reelgood Weekly Streaming Top 10 (US), January 2025 through June 2026. Analysis covers the weekly overall Top 10 list, 26 weeks and 260 ranked spots per half-year period. Tag counts use each title’s first four tags and genre counts use each title’s first three genres, reflecting priority order. Makeup-change percentages sum the absolute year-over-year difference in each tag’s or genre’s spot count, relative to total appearances.