How Many Movies and TV Shows Do You Get Per Dollar? The 2026 Streaming Value Scorecard
Key Takeaways
- Four major ad-free streaming services now charge between $18.49 and $19.99 per month. The price gap between Netflix, Disney+, Hulu, and HBO Max has narrowed to just $1.50. But the content you get for that near-identical price varies by more than 3x.
- Netflix leads among traditional streamers at 251 movies and 186 TV shows per dollar, and actually improved its content-per-dollar ratio year over year despite an 11% price increase. The catalog grew faster than the price.
- Disney+ delivered the biggest value improvement. Movies per dollar rose from 94 to 110 and TV shows per dollar jumped from 42 to 69, a 64% increase on the TV side, even as the monthly price rose 19%.
- Peacock saw the steepest value erosion in the dataset. Movies per dollar dropped from 339 to just 74: a loss of 265 movies per dollar in a single year. Prices went up 21%.
- Prime Video remains the volume leader at 2,722 movies and 643 TV shows per dollar, but the introduction of the $4.99 Ultra ad-free add-on pushed the effective ad-free price from $8.99 to $13.98, a 56% year-over-year increase.
- Every streaming service we tracked except Hulu raised ad-free tier prices year over year. The average increase across the seven services we tracked was 18%.
Every major streaming service in the U.S. raised ad-free tier prices in the past year. Netflix’s standard ad-free plan hit $19.99 in March 2026, its second increase in under two years. Disney+ went from $15.99 to $18.99. Peacock Premium Plus jumped to $16.99. Amazon introduced a new $4.99 Ultra add-on to restore the ad-free experience that used to come standard.
The price increases are well-documented. What hasn’t been quantified is whether the content behind those prices kept pace.
Using Reelgood’s streaming availability database, we calculated movies per dollar and TV shows per dollar for the ad-free tiers of seven major U.S. streaming services as of March 31, 2026, then compared those ratios against the same services in February 2025. The question isn’t just “who costs more?” It’s: who is actually maintaining their value proposition as prices climb, and who isn’t?
Content acquisition teams evaluating competitive positioning, licensing analysts benchmarking catalog depth, and product strategy teams deciding where to invest all face the same question. And without catalog-level data, the answer is usually a guess.
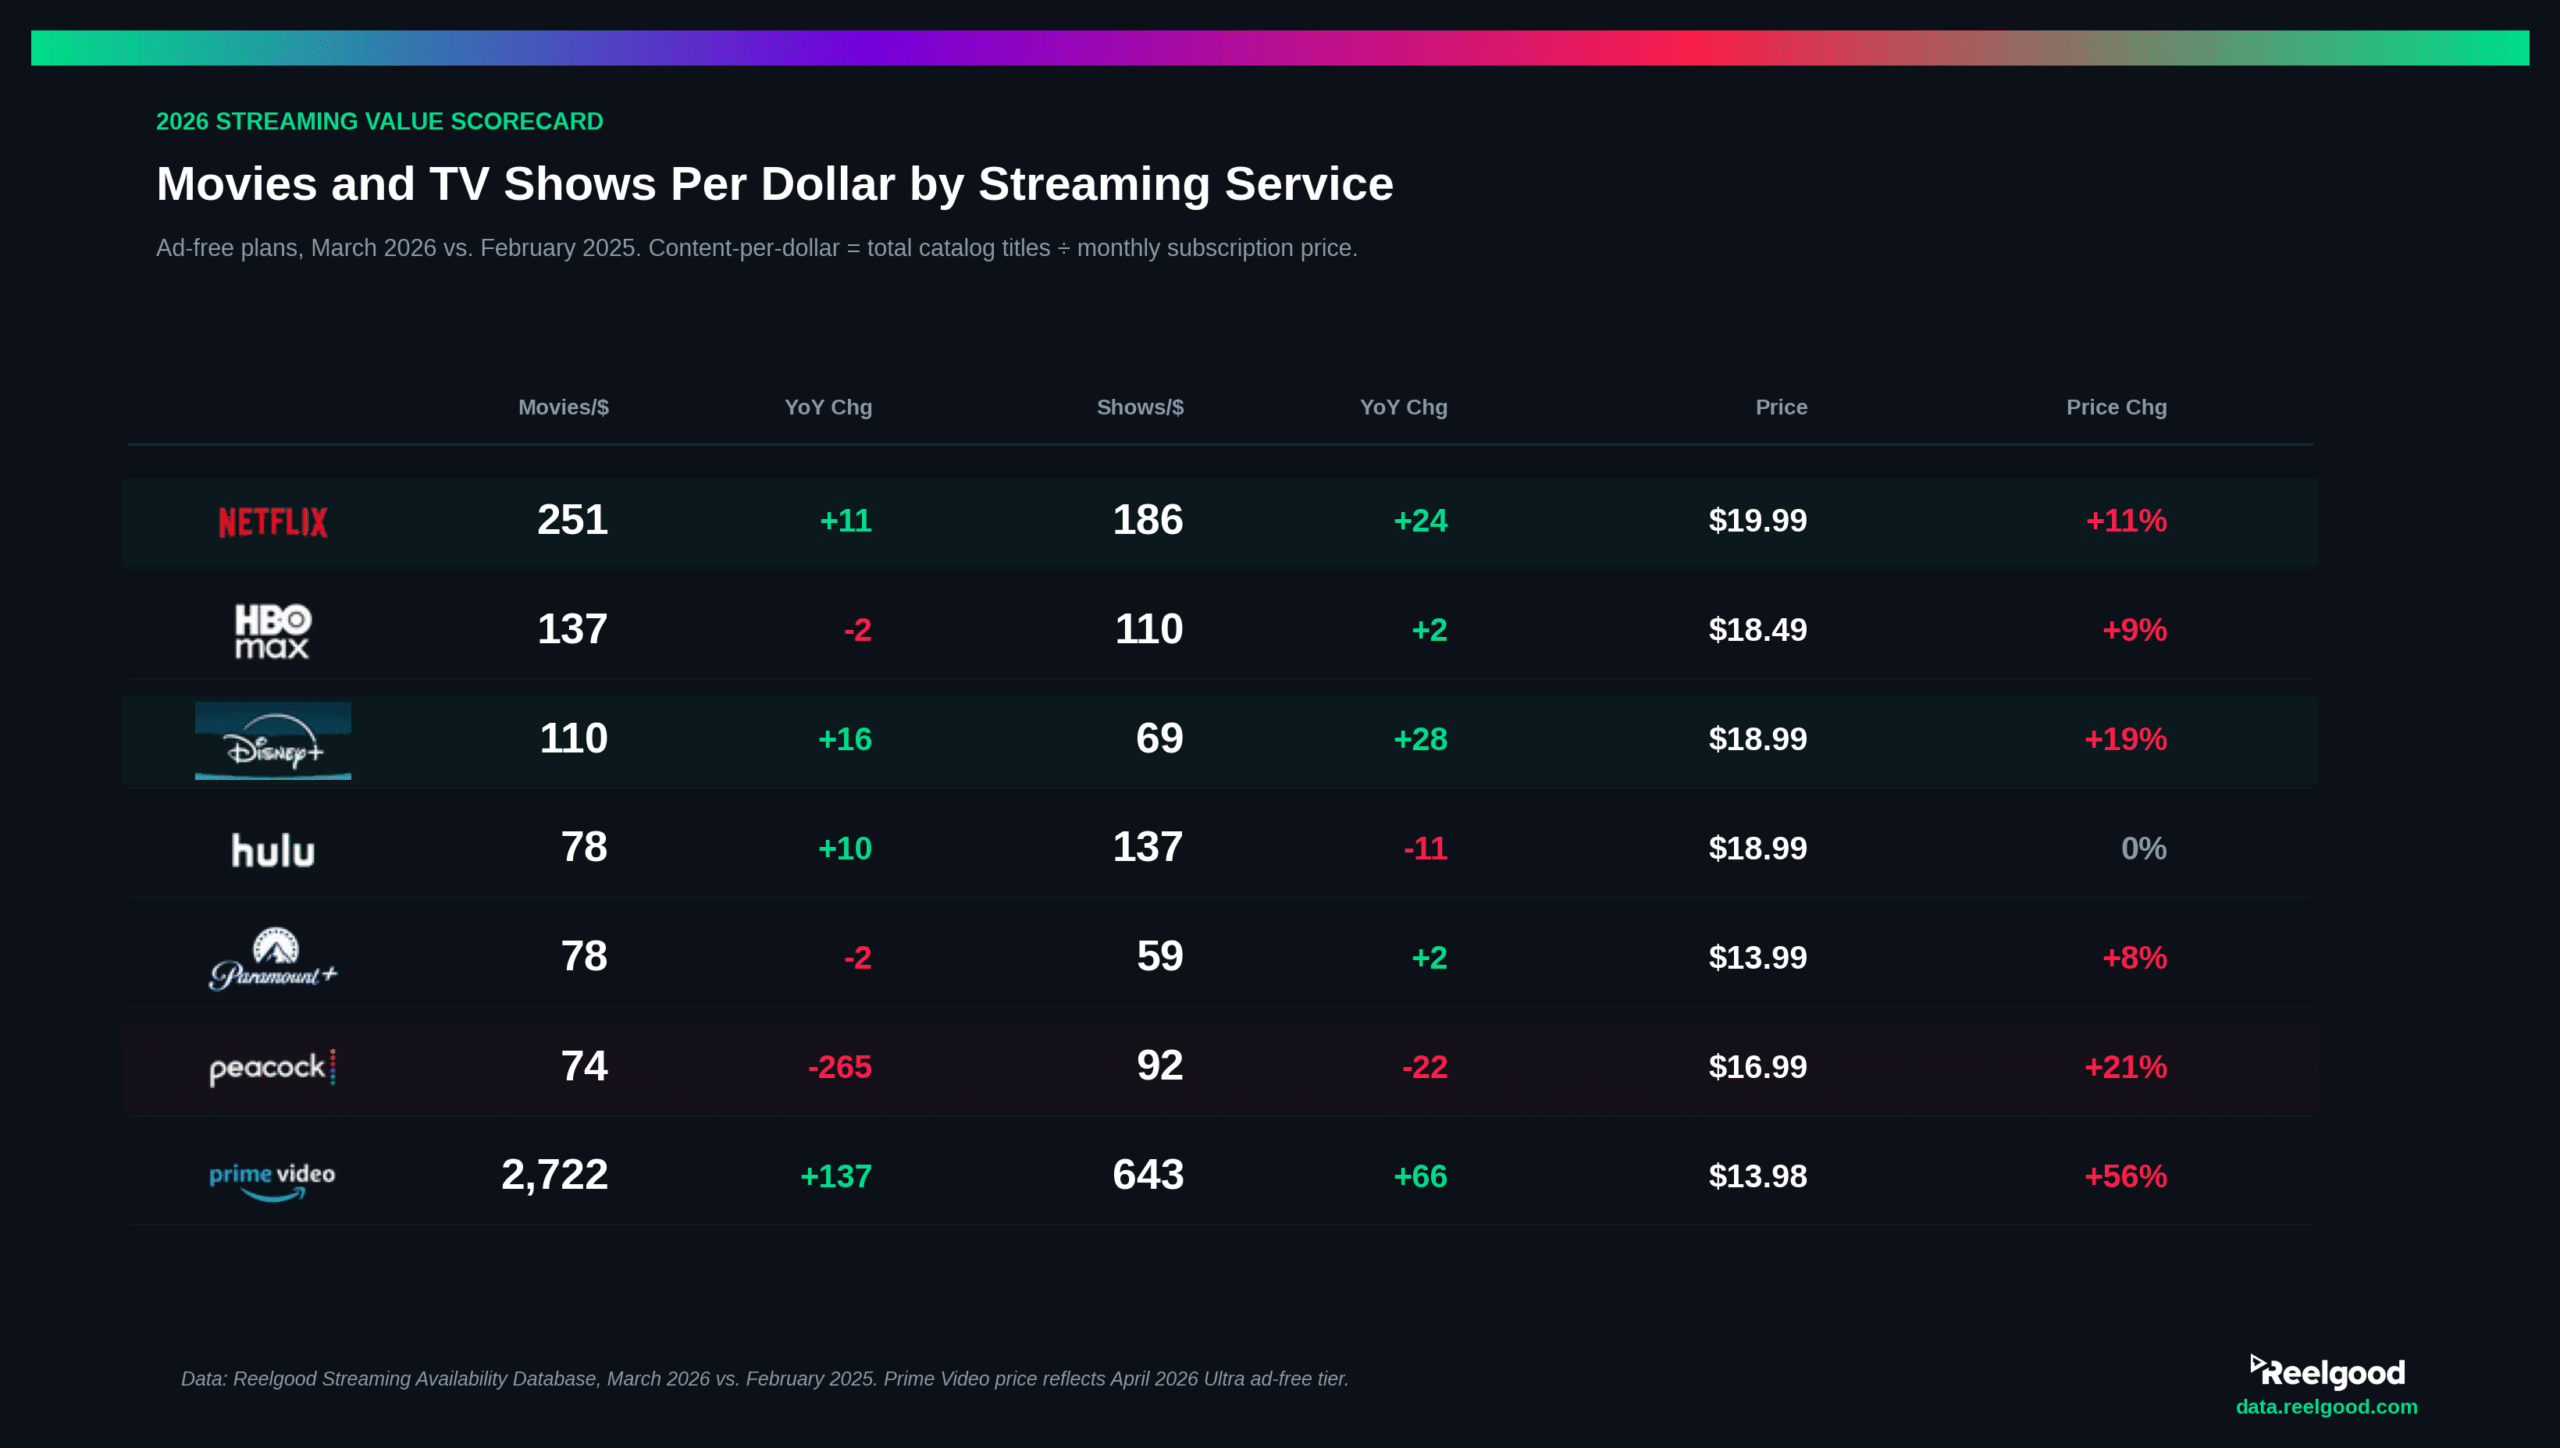
2026 Streaming Value Scorecard: Movies and TV shows per dollar by streaming service, March 2026 vs. February 2025. Data: Reelgood Streaming Availability Database.
Same Price, Very Different Libraries
The most striking finding has nothing to do with any single service. It’s the convergence.
Netflix, Disney+, Hulu, and HBO Max now all price their standard ad-free tiers between $18.49 and $19.99. A year ago, the spread was wider. Today, a subscriber choosing between these four services is essentially paying the same monthly fee.
What they get for it is not remotely equivalent.
Netflix delivers 251 movies per dollar and 186 TV shows per dollar. HBO Max comes in at 137 and 110, respectively. Disney+ sits at 110 and 69. At the bottom of the near-$19 tier, Hulu offers just 78 movies per dollar and 137 shows per dollar.
Put differently: for roughly the same price,
Netflix gives you 3.2x more movies per dollar than Hulu and 2.3x more than Disney+.
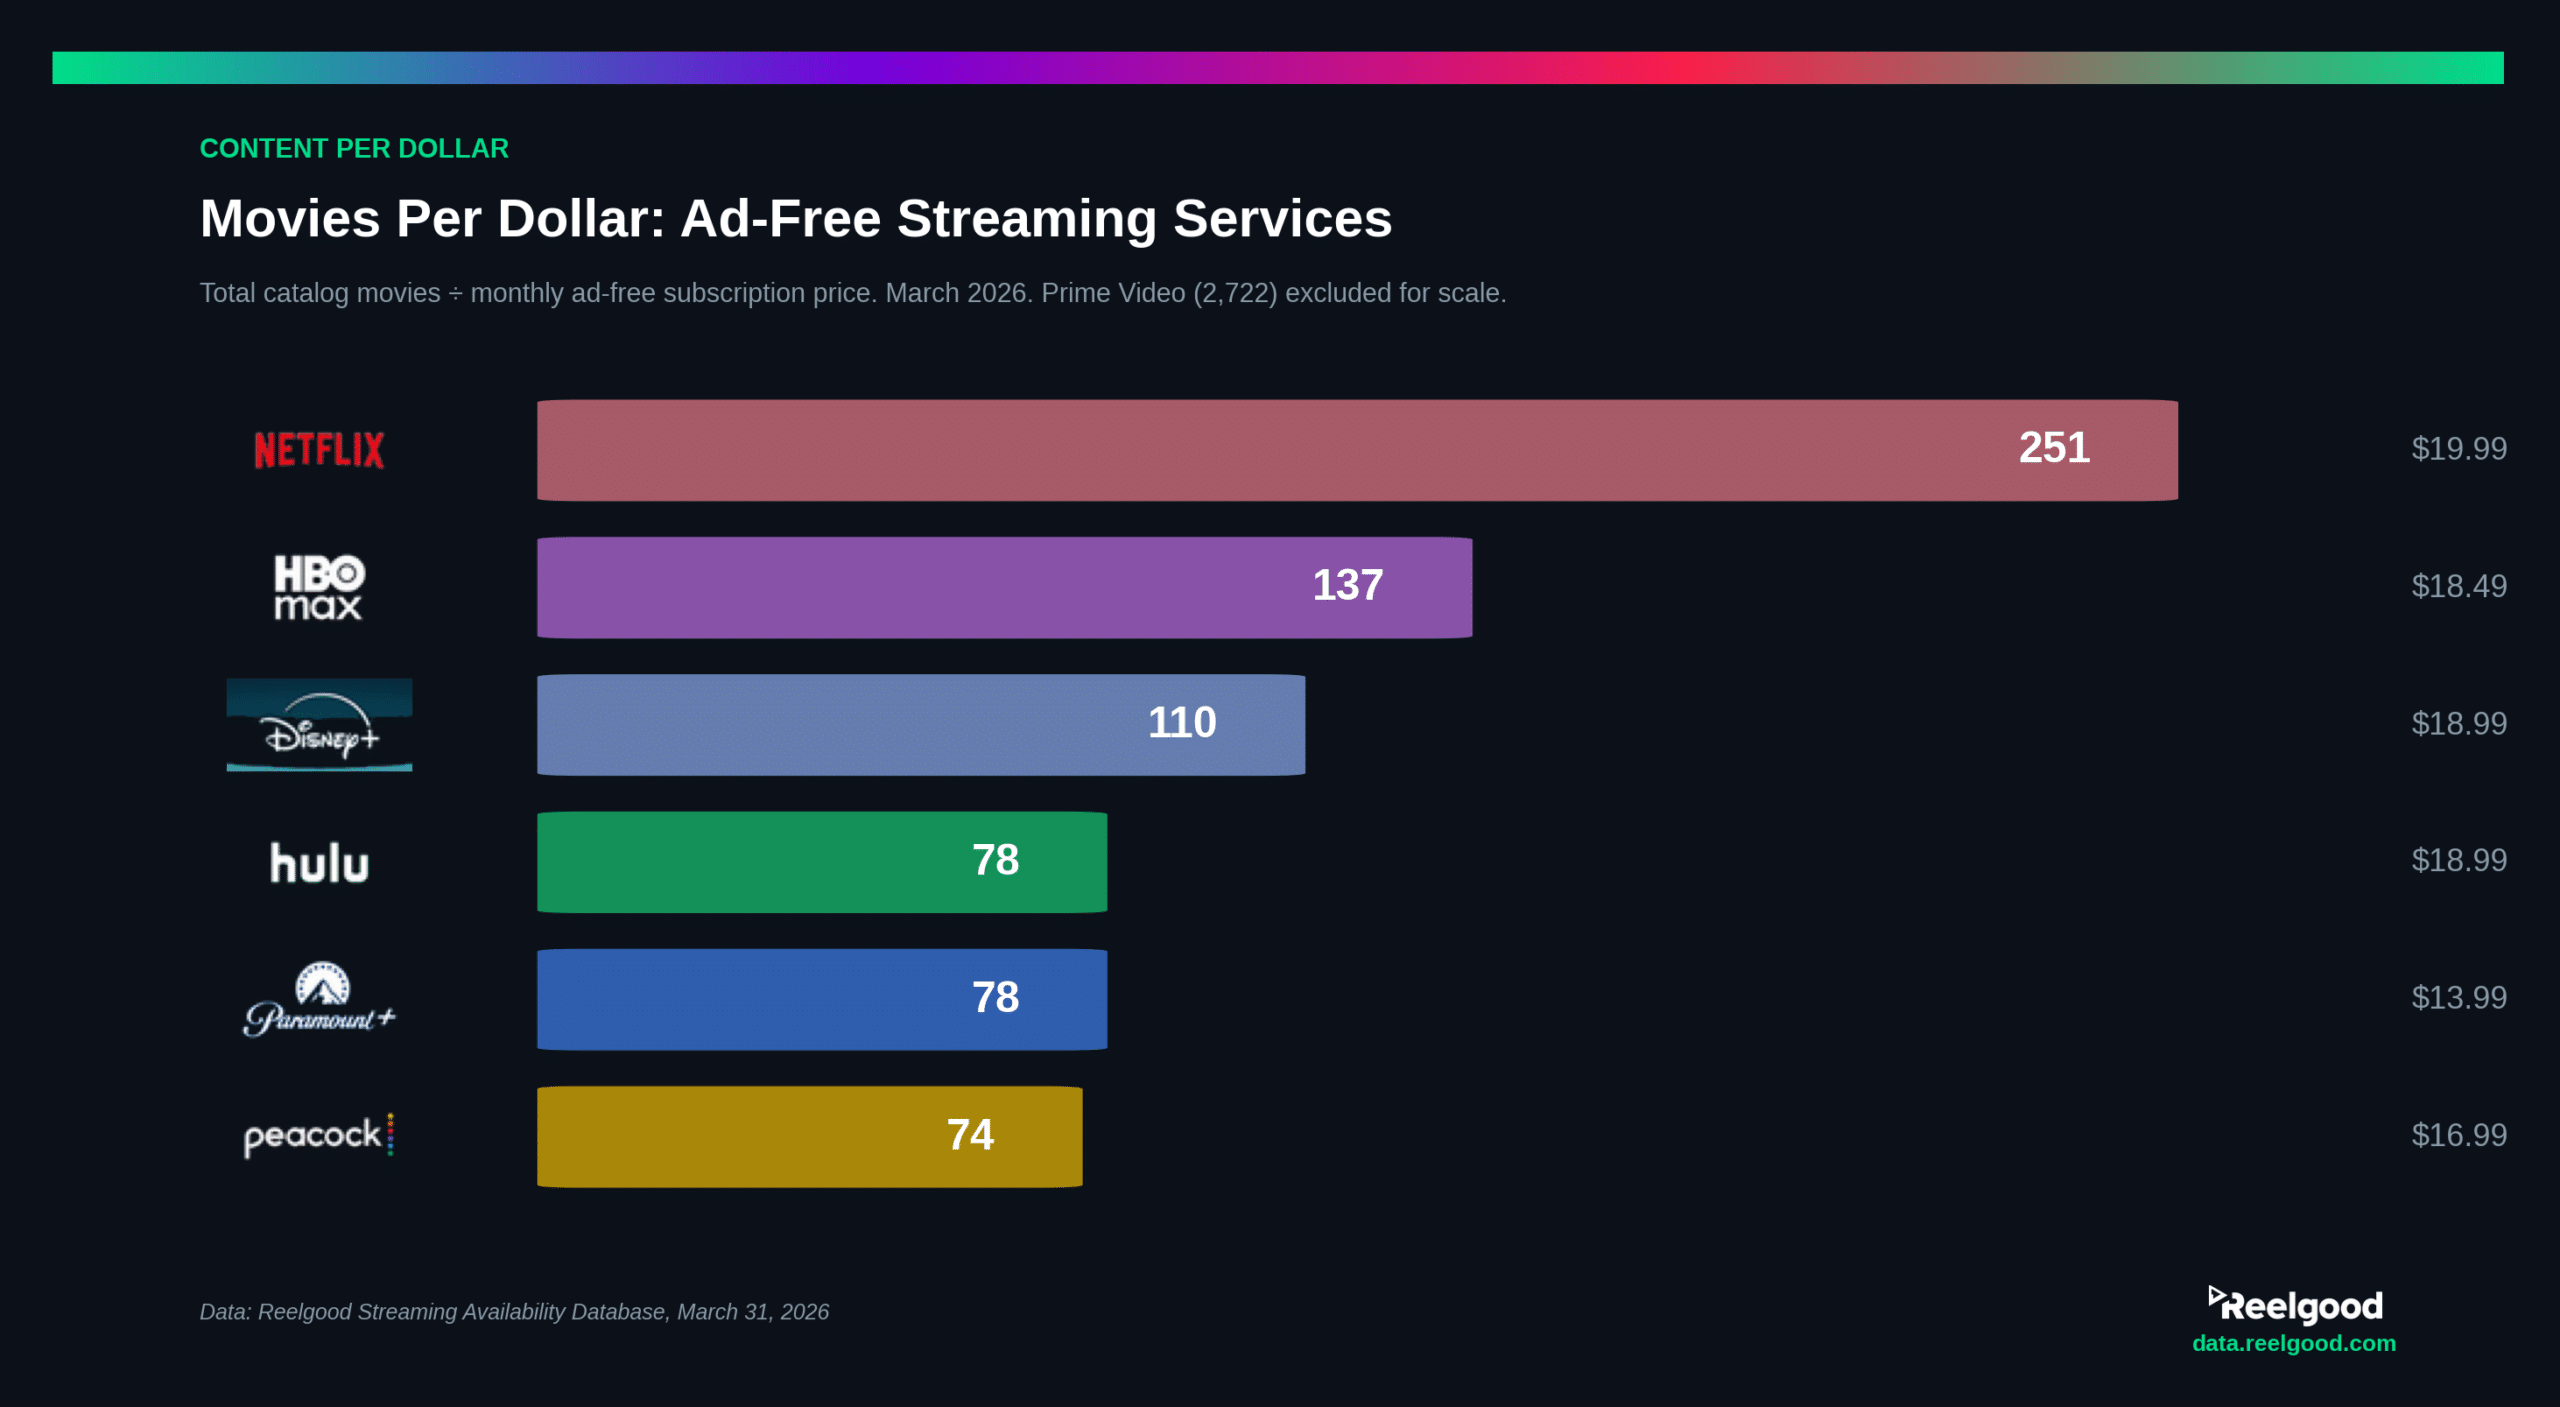
Movies per dollar across ad-free streaming services, March 2026. Prime Video (2,722) excluded for scale. Data: Reelgood Streaming Availability Database.
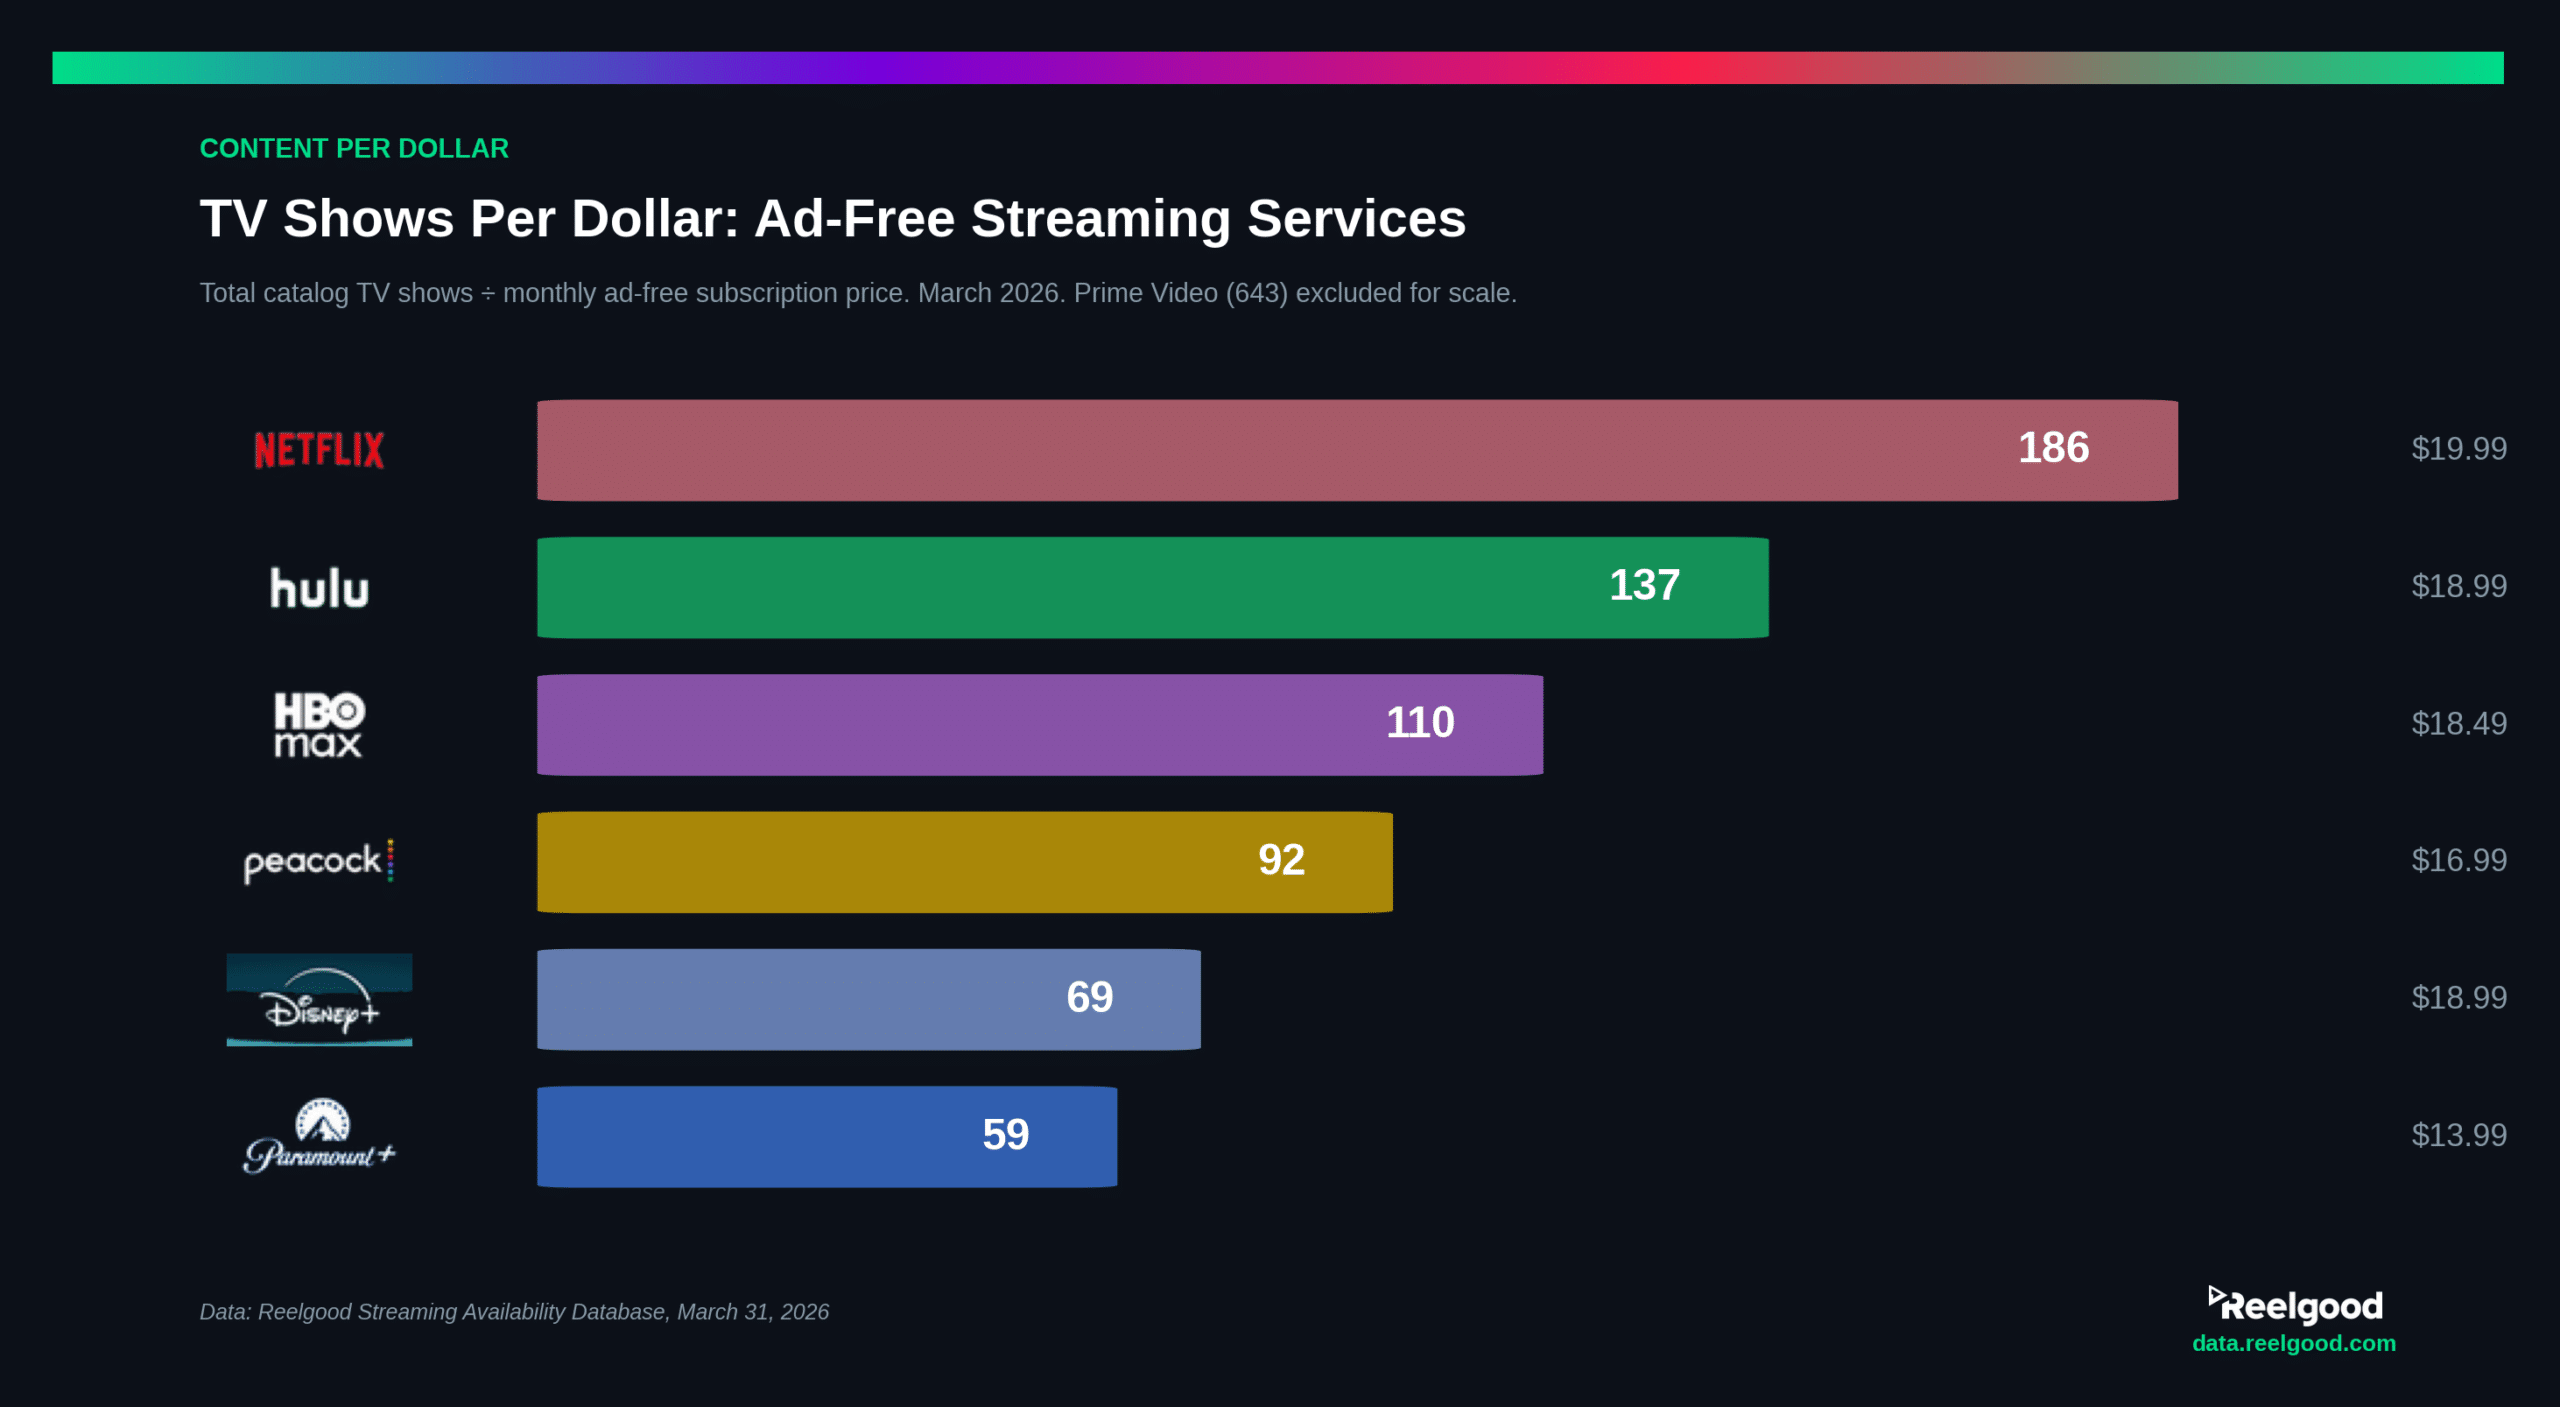
TV shows per dollar across ad-free streaming services, March 2026. Prime Video (643) excluded for scale. Data: Reelgood Streaming Availability Database.
This matters for competitive intelligence teams tracking how rival services position their catalogs.
Pricing convergence creates an illusion of equivalence.
The content-per-dollar ratio reveals the actual strategic differentiation behind the price tag. When Variety reported that Netflix earns just $0.48 per hour viewed compared to $0.64-$0.93 at competitors, the catalog depth data explains why: Netflix is spreading its subscription revenue across a significantly larger library.
The Year-Over-Year Value Shift: Winners and Losers
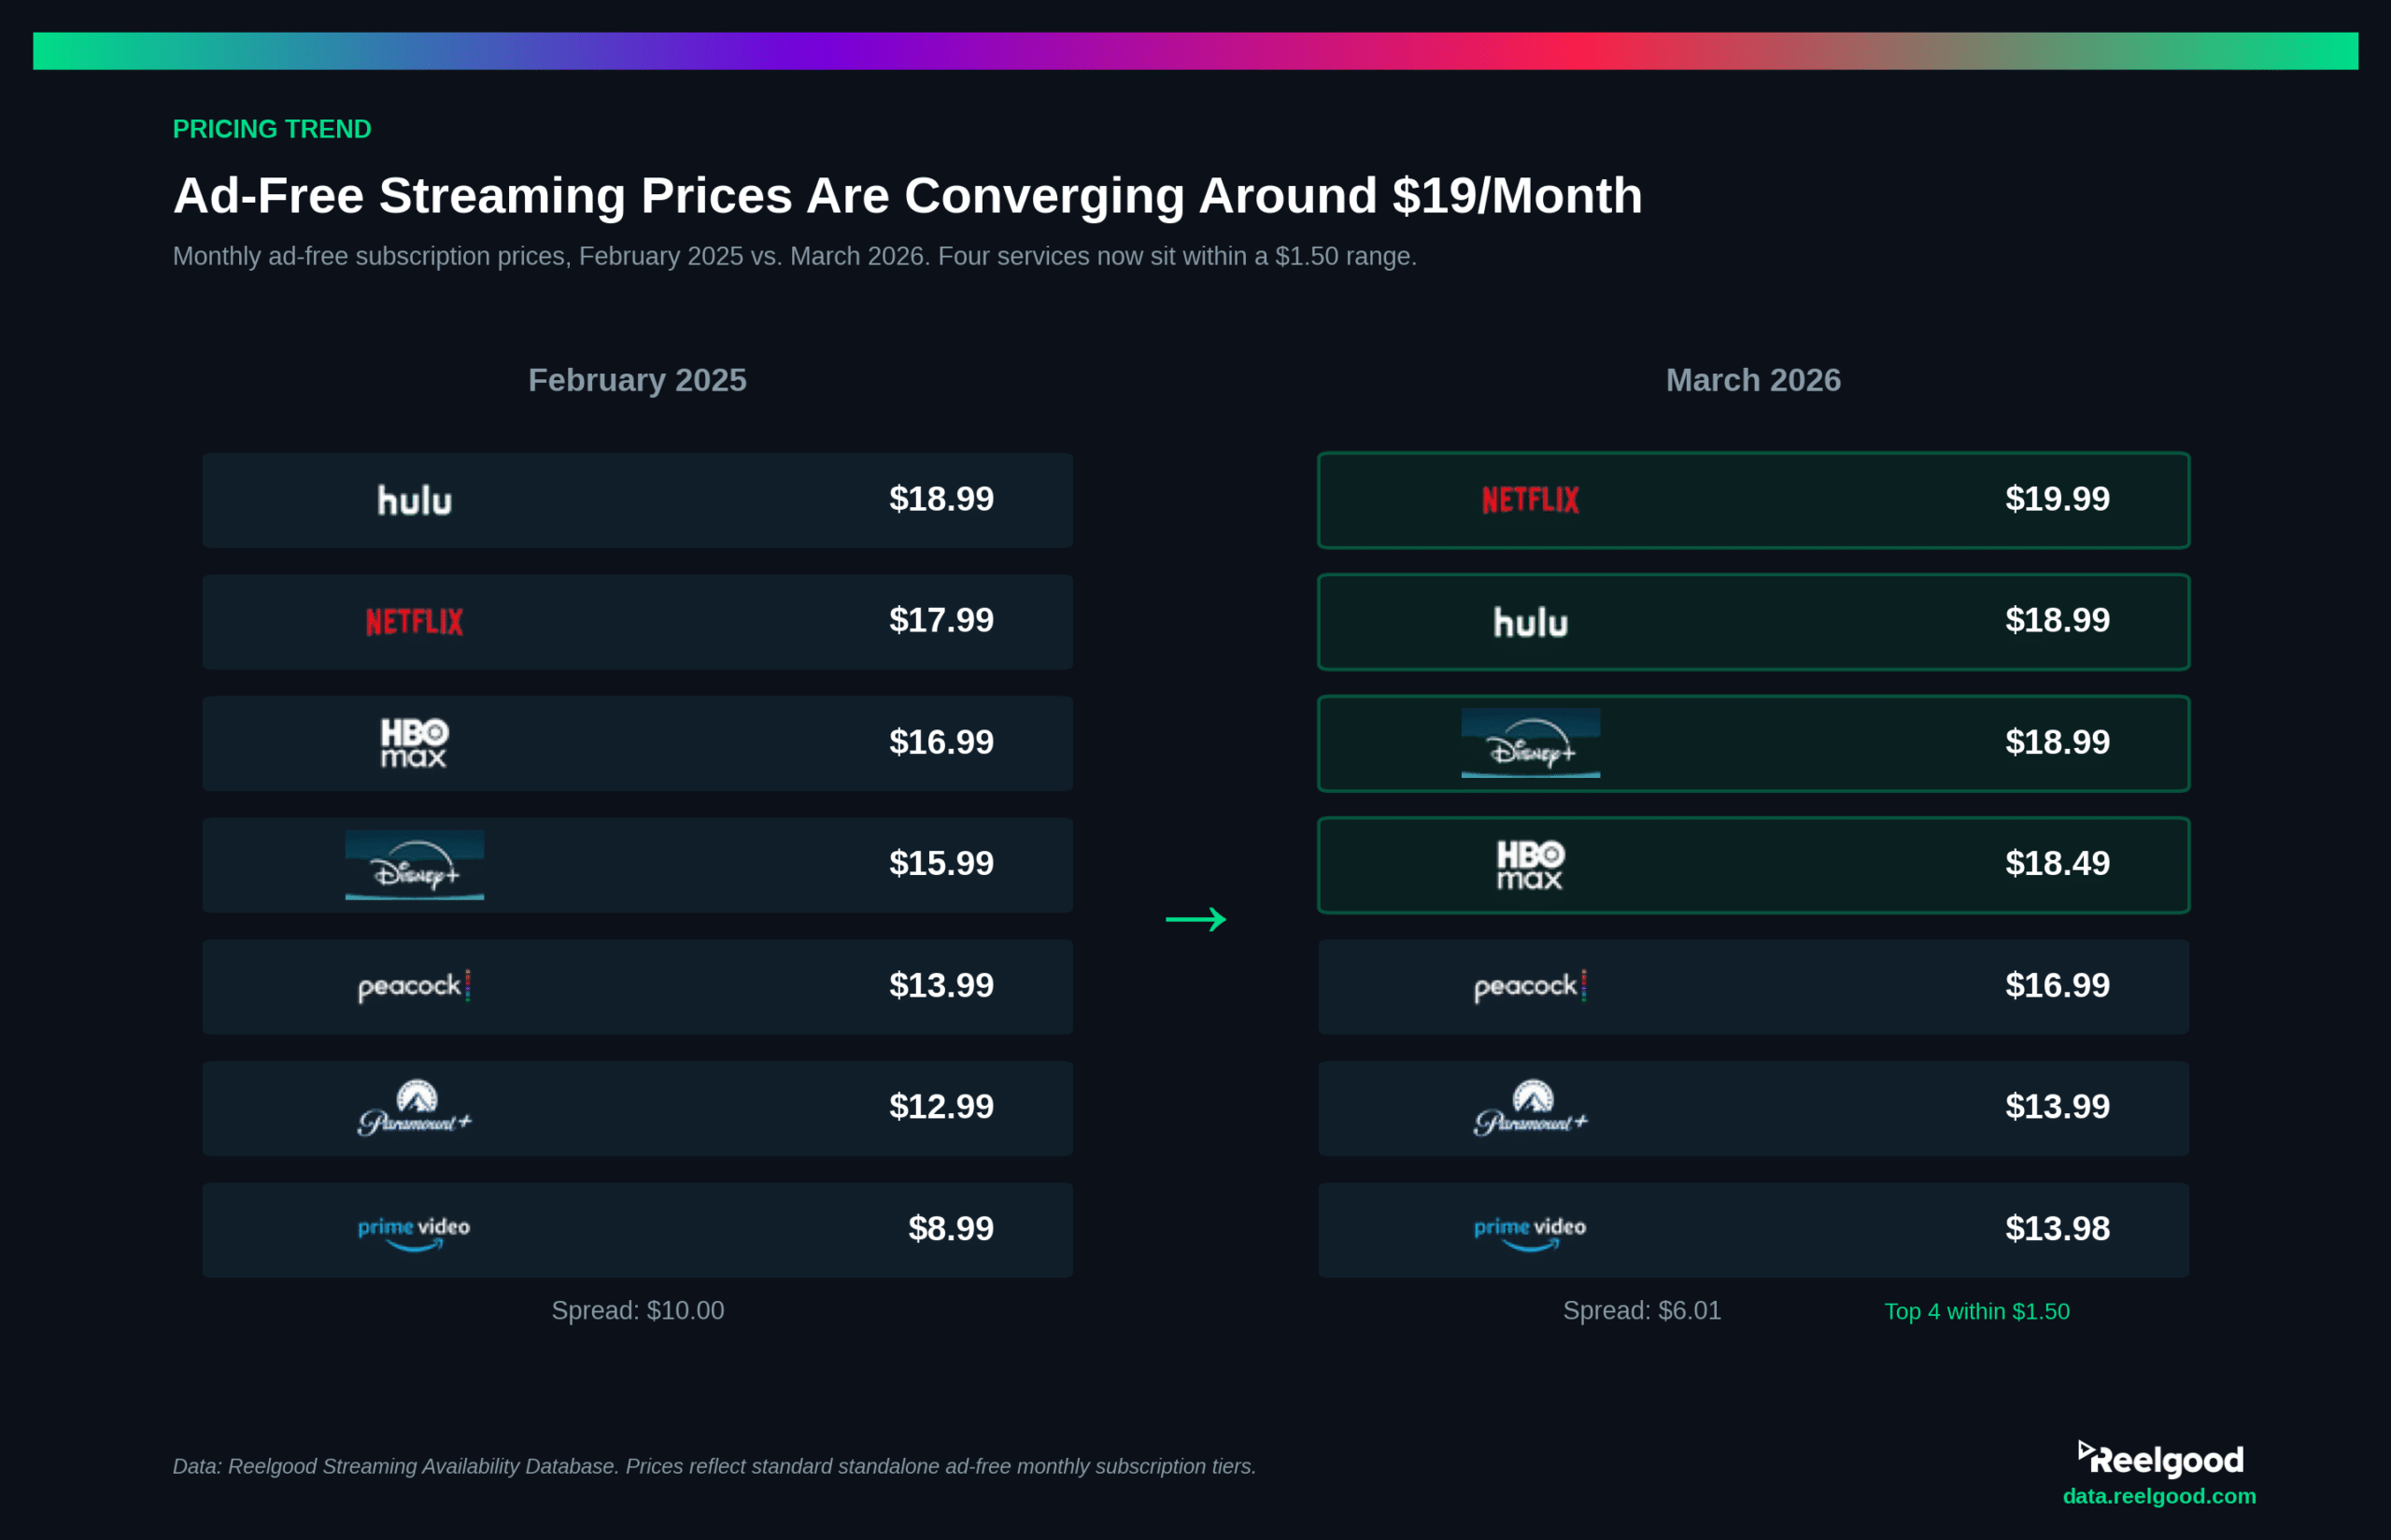
Ad-free streaming prices are converging: four major services now charge between $18.49 and $19.99 per month. Data: Reelgood Streaming Availability Database.
Price increases don’t automatically erode value.
If a service adds catalog faster than it raises prices, subscribers get more for their money, not less. That’s exactly what happened at two of the seven services we tracked.
The others tell a different story.
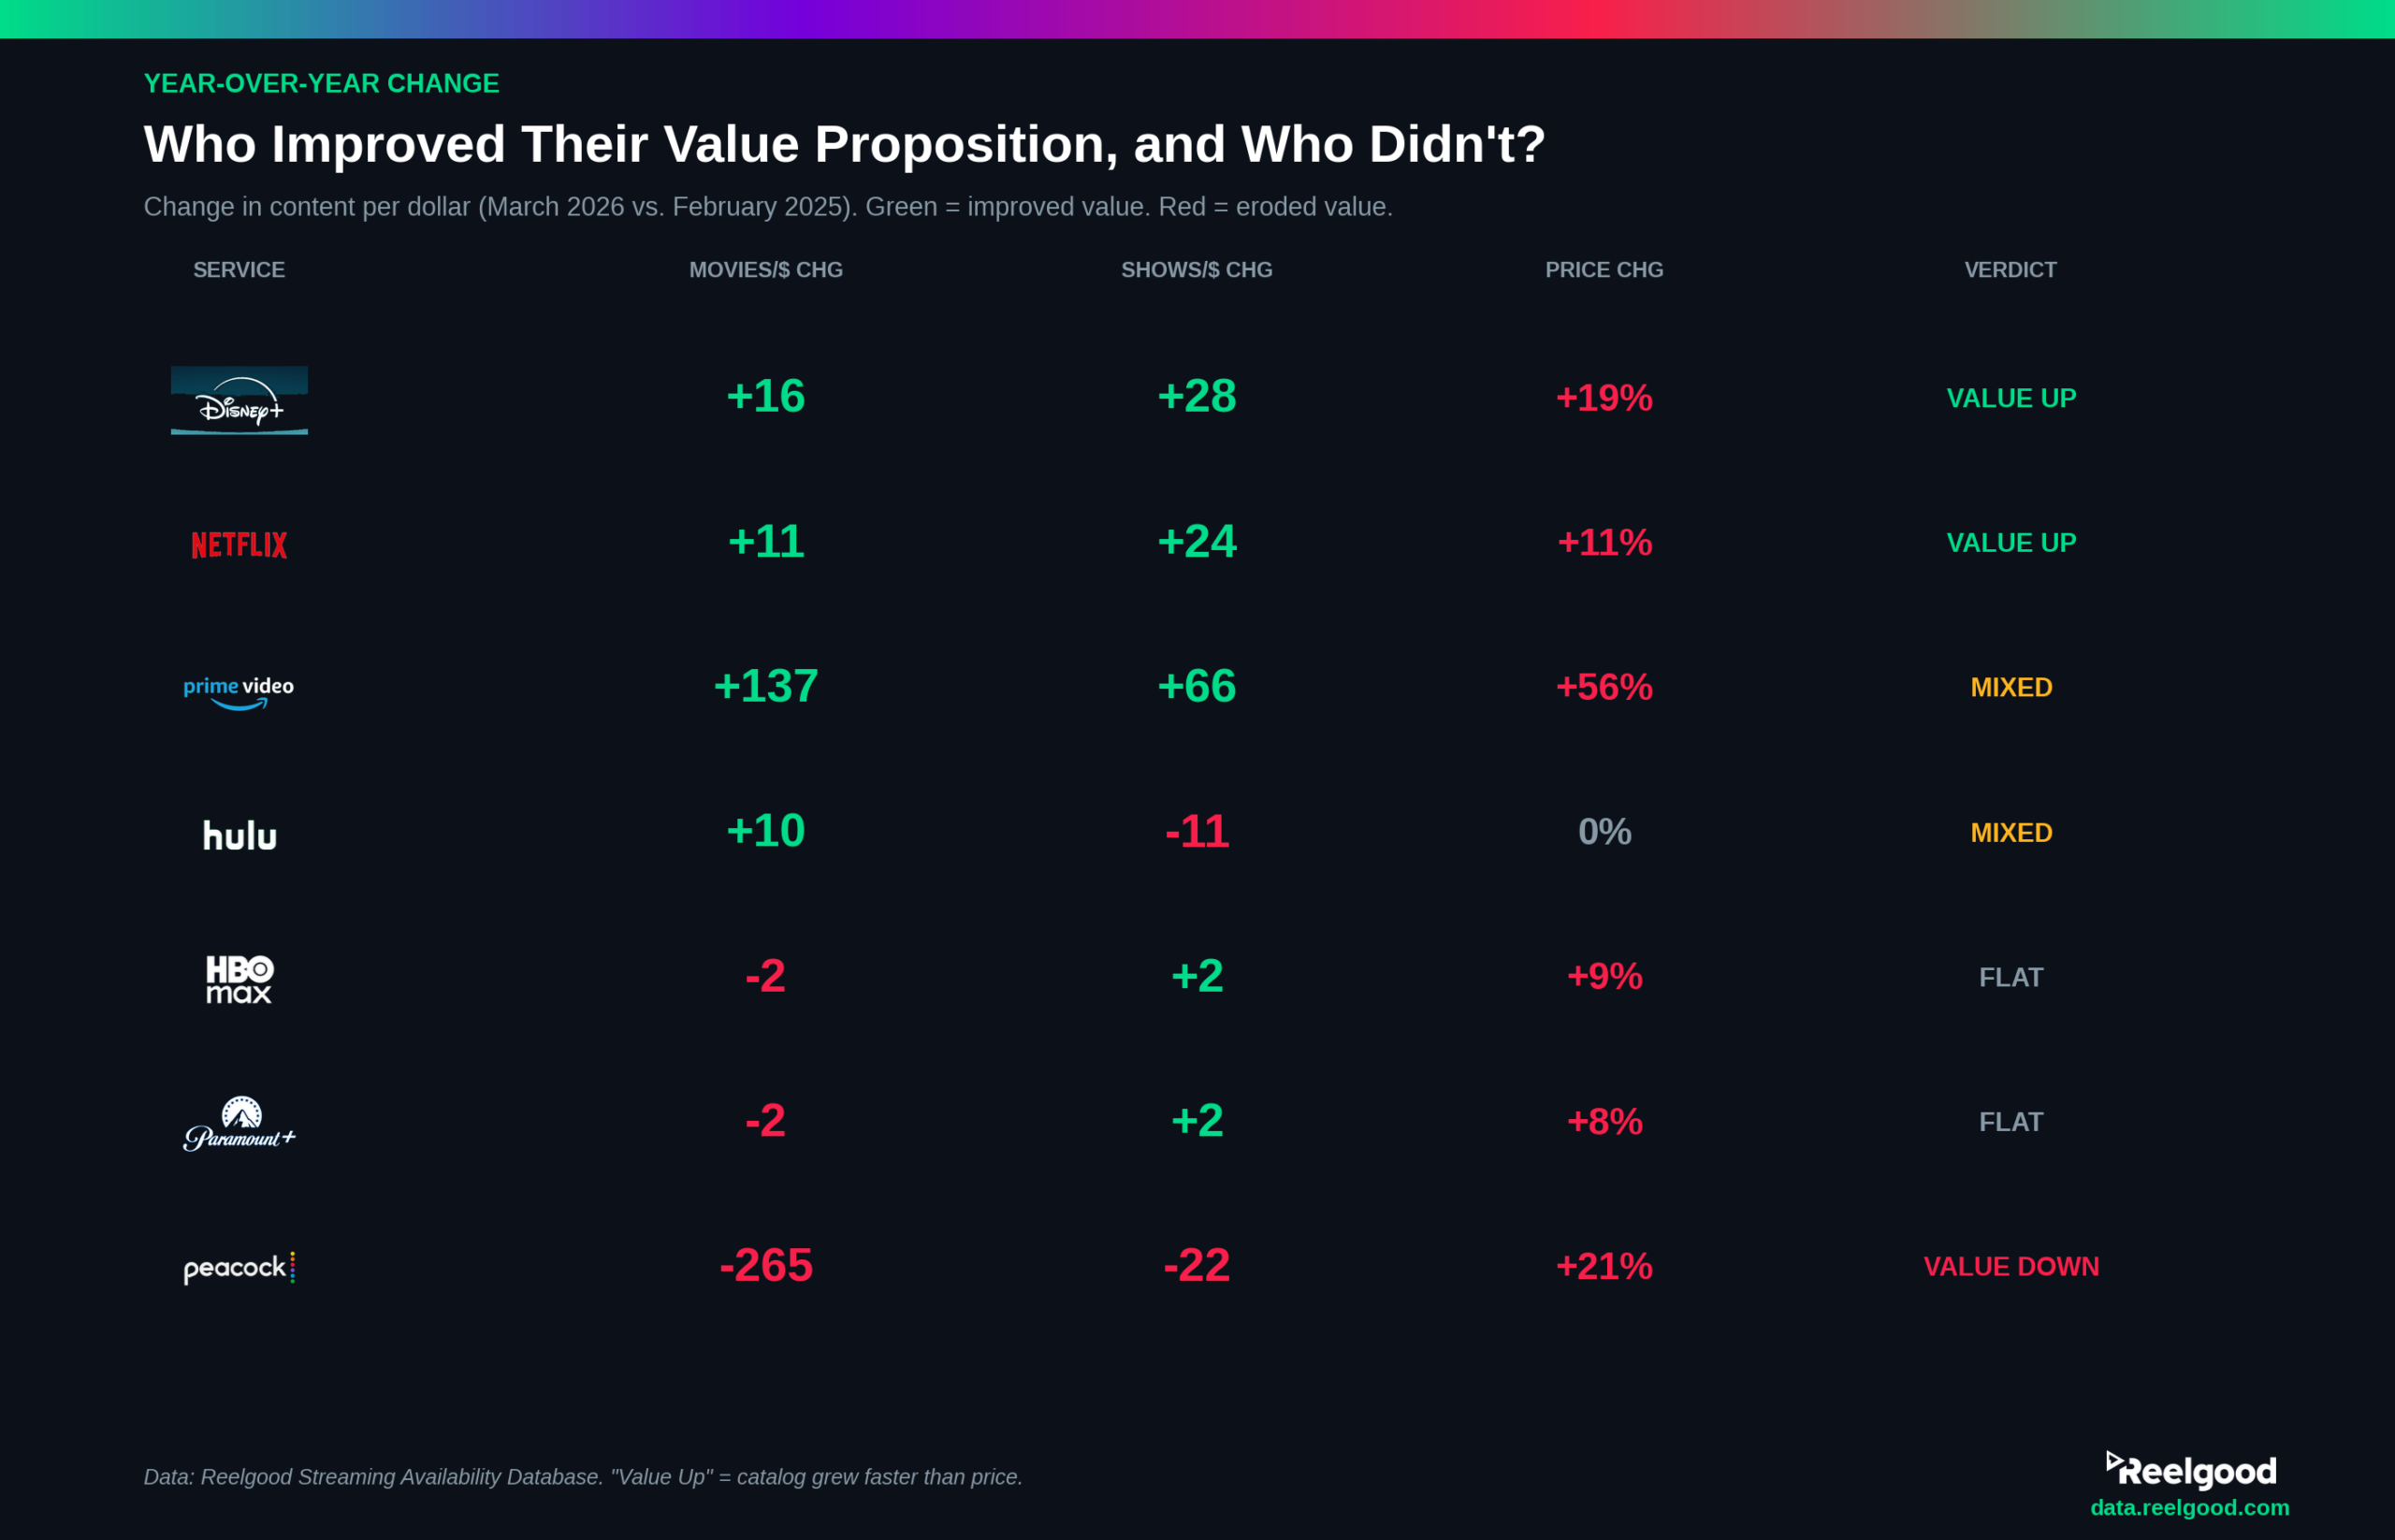
Year-over-year change in content per dollar, March 2026 vs. February 2025. Green indicates improved value; red indicates eroded value. Data: Reelgood Streaming Availability Database.
Netflix: More Content, Higher Price, Better Ratio
Netflix raised its ad-free price 11%, from $17.99 to $19.99. But movies per dollar rose from 239 to 251 (+5%) and TV shows per dollar jumped from 161 to 186 (+16%). The catalog expanded faster than the price. For a service that already had the deepest traditional streamer library, that’s a meaningful signal:
Netflix is still investing in breadth, not just tentpole originals.
Content licensing teams watching Netflix’s strategy should note that this isn’t a service trimming its library to protect margins. The catalog is growing, and the per-dollar value is growing with it.
Disney+: The Biggest Value Jump
Disney+ raised prices 19%: from $15.99 to $18.99. On paper, that’s aggressive. But the content-per-dollar numbers tell a different story. Movies per dollar rose from 94 to 110 (+17%), and TV shows per dollar surged from 42 to 69 (+64%).
A 64% increase in TV shows per dollar is the largest single-category improvement in the dataset.
Disney+ has been steadily deepening its library beyond the core Disney/Marvel/Star Wars brands, and the data shows it.
For competitive intelligence analysts, this is evidence that Disney+ is evolving its catalog strategy to compete on volume, not just franchise exclusivity.
HBO Max: Stable Value, Modest Price Increase
HBO Max raised prices 9%, from $16.99 to $18.49. Content-per-dollar ratios were nearly flat: movies per dollar dipped slightly from 140 to 137 (-2%), while TV shows per dollar edged from 108 to 110 (+2%). HBO Max isn’t growing its library aggressively, but it isn’t shrinking it either.
Its value proposition remains rooted in perceived content quality rather than volume, and the per-dollar data reflects that positioning.
Paramount+: Holding Steady, But Falling Behind on Scale
Paramount+ Premium went from $12.99 to $13.99 (+8%). Content-per-dollar ratios were flat: movies per dollar slipped from 80 to 78, TV shows per dollar moved from 57 to 59.
At $13.99, Paramount+ remains the second-cheapest ad-free option in this analysis, but its library is also among the smallest.
For licensing and catalog teams, the question is whether Paramount+ can sustain a scaled content strategy as the broader Paramount-WBD merger landscape continues to evolve.
Peacock: The Steepest Value Erosion
Peacock is the outlier, and not in a good way.
The ad-free Peacock Premium Plus tier rose 21%, from $13.99 to $16.99. But the real story is the library. Movies per dollar collapsed from 339 to just 74: a loss of 265 movies per dollar in a single year. TV shows per dollar dropped from 115 to 92.
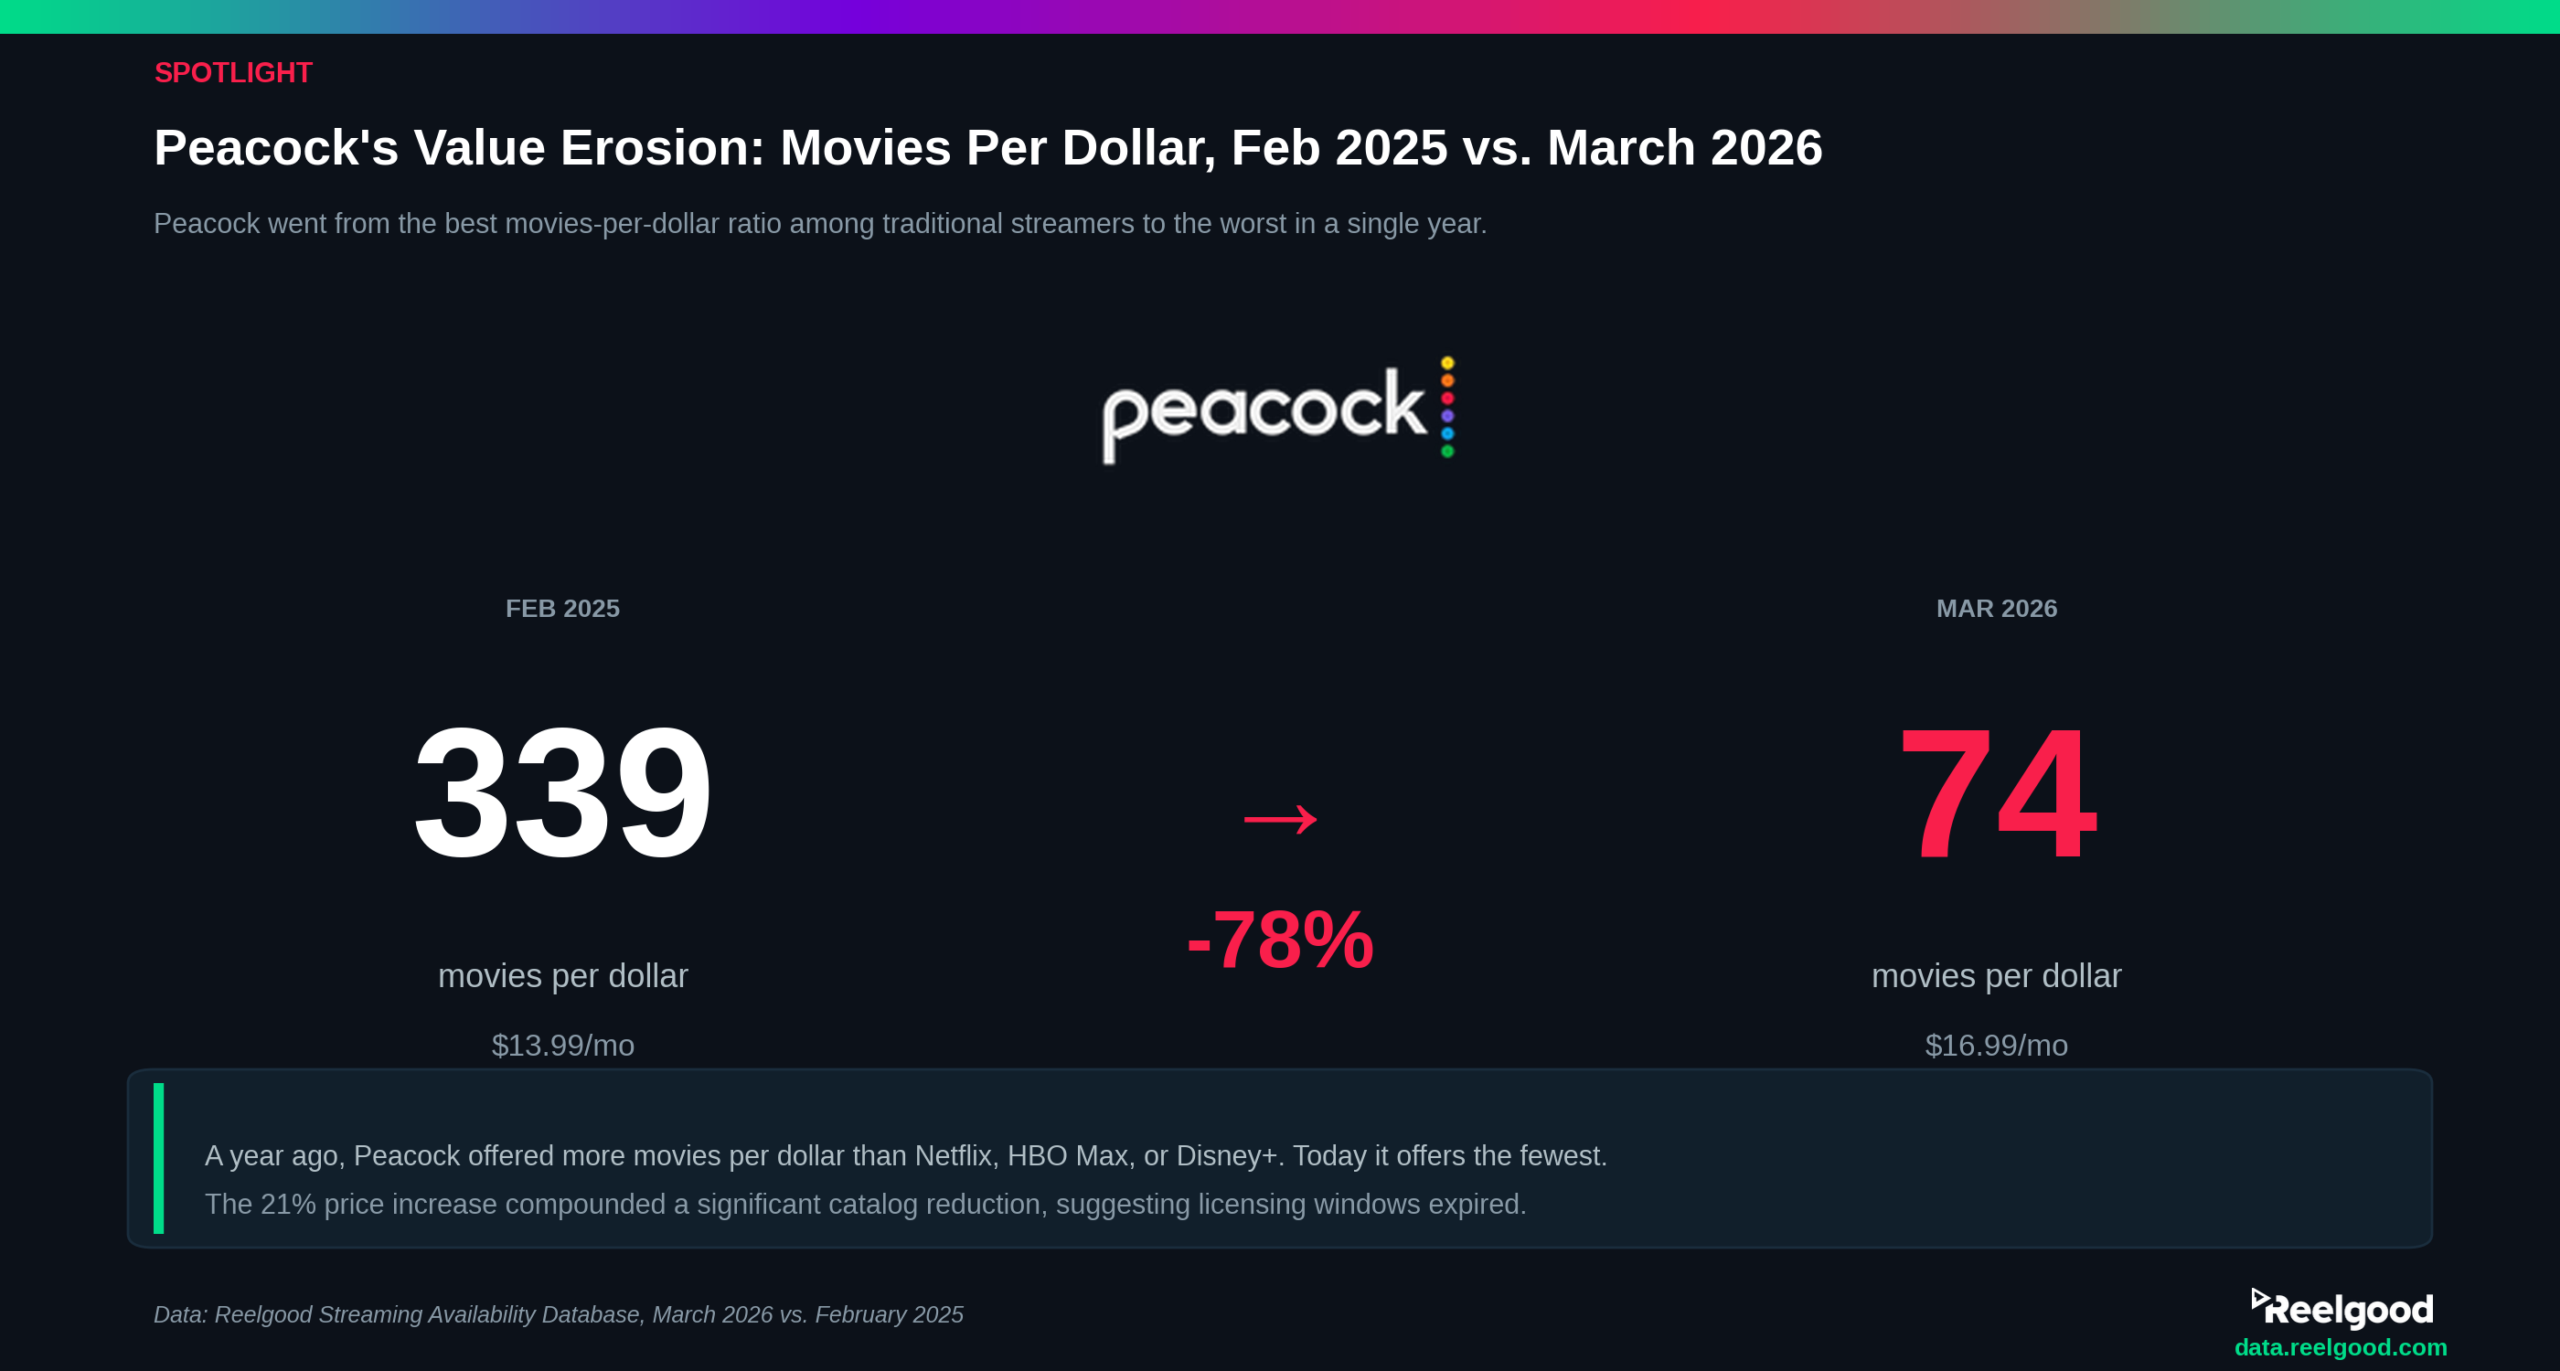
Peacock’s movies per dollar fell 78% year over year, the steepest value erosion of any service in the analysis. Data: Reelgood Streaming Availability Database.
A year ago, Peacock had the best movies-per-dollar ratio of any traditional streamer in this analysis.
Today, it has the worst.
That kind of swing suggests a significant reduction in available catalog titles, likely tied to licensing windows expiring or content being moved to other NBCUniversal distribution channels.
For rights management teams and content analysts tracking windowing behavior, Peacock’s year-over-year shift is one of the most dramatic catalog contractions visible in our data.
Prime Video: Volume King with a New Price Floor
Prime Video remains in a class by itself on volume: 2,722 movies per dollar and 643 TV shows per dollar. No other service comes close. Movies per dollar actually improved year over year, from 2,585 to 2,722 (+5%), and TV shows per dollar rose from 576 to 643 (+12%).
But the cost structure changed significantly.
Amazon introduced the $4.99/month Ultra add-on in 2026 to restore the ad-free viewing experience that was previously included in the base Prime Video subscription. The effective ad-free price rose from $8.99 to $13.98, a 56% increase. Amazon’s decision to layer an ad-free tier onto what was already a paid subscription mirrors a broader industry pattern: making ad-free the premium upsell rather than the default experience.
Even at $13.98, Prime Video’s content-per-dollar metrics dwarf the competition. But for competitive analysts tracking the economics of ad-free streaming, the Ultra tier signals where Amazon sees pricing leverage.
The Catalog Intelligence Gap
Subscription price and subscriber count dominate the streaming economics conversation. But neither answers the question that content strategy teams need answered: what is each competitor putting on the shelf, and how does that compare to what they’re charging for access?
Content-per-dollar ratios reveal strategic intent.
- Netflix is competing on library breadth and depth simultaneously.
- Disney+ is expanding beyond its franchise core.
- Peacock appears to be contracting.
These are signals that content acquisition, licensing, and competitive intelligence teams can act on, provided they have the catalog-level data to track it.
As we found in our Streaming Iceberg analysis, only about 12% of movies in active distribution are available on the top eight U.S. SVOD services. The other 88% is distributed across hundreds of smaller services, AVOD platforms, and TVOD storefronts. Content-per-dollar ratios at the major services are just the visible layer of a much deeper catalog fragmentation story.
The Broader Context: Pricing Pressure Meets Catalog Pressure
These value shifts aren’t happening in a vacuum.
According to a 2025 YouGov survey, 74% of Americans now cite cost as the top factor when choosing a streaming service.
Deloitte’s 2026 Digital Media Trends study found that roughly two-thirds of U.S. streaming subscribers now pay for an ad-supported tier, up from 54% in 2024 and 46% the year prior. Subscribers are getting more price-sensitive at the same time that services are raising prices and, in some cases, reducing catalog depth.
For product and platform strategy teams, this creates a compounding challenge. Raising prices without maintaining or expanding the catalog risks accelerating churn. Maintaining the catalog while raising prices requires content acquisition investment that not every service can sustain. And the shift toward ad-supported tiers means the ad-free subscriber base, while more valuable per user, may be shrinking as a percentage of total subscribers.
Understanding how these dynamics play out at the catalog level, service by service, title by title, is the kind of analysis that requires structured, real-time streaming availability data rather than periodic press releases or quarterly earnings calls.
Reelgood tracks title availability across 300+ streaming services globally, updating every few minutes with 99+% accuracy. The analysis behind this post is a fraction of what the full dataset supports.
- Content licensing and acquisition teams can request a competitive catalog breakdown by service, genre, and content type: request a data sample.
- Competitive intelligence and analytics teams can explore historical availability trends, catalog overlap analysis, and real-time monitoring across 300+ services: see streaming data use cases.
- Rights management teams tracking windowing behavior (like Peacock’s catalog contraction) can access historical streaming availability data going back years.
Data: Reelgood Movie & TV Metadata & Streaming Availability Database, March 2026 and February 2025. Analysis covers Amazon Prime Video, Disney+, HBO Max, Hulu, Netflix, Paramount+, and Peacock. “Movies per dollar” and “TV shows per dollar” are calculated by dividing the total catalog count (as of the analysis date) by the price of a standard standalone ad-free monthly subscription. Prime Video pricing reflects the upcoming April 10, 2026 Prime Video Ultra pricing ($8.99 + $4.99 ad-free add-on).