Streaming Industry Insights

Streaming industry analysis and & insights, product updates, and weekly rankings powered by comprehensive Reelgood global metadata and title availability data.

Featured Posts
Recent Posts
Reelgood Streaming Top 10 chart for September 10 to September 16, 2026, ranking ten movies and TV shows: Mayday on Apple TV at #1, Lanterns on HBO Max at #2, Practical Magic on HBO Max at #3, The Gentlemen on Netflix at #4, Reacher on Prime Video at #5, Supergirl on HBO Max at #6, Ted Lasso on Apple TV at #7, Why Did I Get Married Again? on Netflix at #8, Silo on Apple TV at #9, and Lioness on Paramount+ at #10.
Rankings

Reelgood Streaming Top 10: Same-Day Premieres Put HBO Max Level With Apple TV

Here’s your Reelgood Streaming Top 10 (movies & TV) snapshot for September 10-16, 2026: HBO Max and Apple TV each placed three titles on…
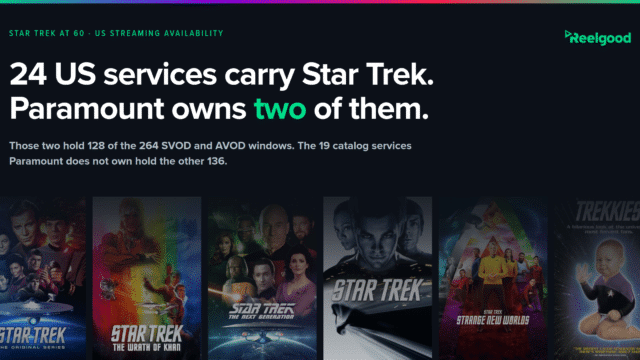
Reelgood graphic headed "24 US services carry Star Trek. Paramount owns two of them," with the line "Those two hold 128 of the 264 SVOD and AVOD windows. The 19 catalog services Paramount does not own hold the other 136." A row of Star Trek posters runs along the bottom: The Original Series, The Wrath of Khan, The Next Generation, Star Trek (2009), Strange New Worlds, and Trekkies.
Insights and Trends

Paramount Owns Star Trek. Half Its US Streaming Windows Are Somewhere Else.

This is the first of two posts marking Star Trek’s 60th anniversary with Reelgood’s US availability data. This one covers where Star Trek actually…
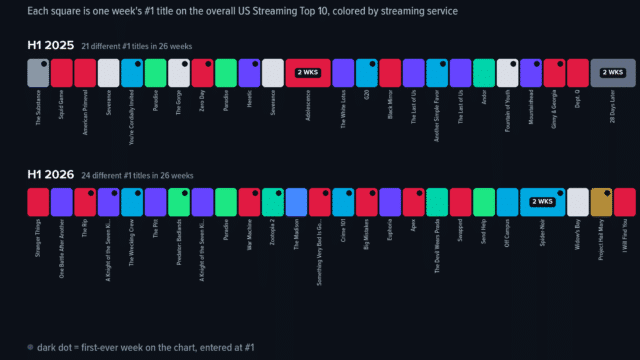
Two-row timeline graphic titled Streaming's number one spot changes hands almost every week. Each row shows 26 week squares for a half-year, H1 2025 on top and H1 2026 below, with each square colored by the service of that week's number-one title and the title name printed vertically beneath it. H1 2025 shows 21 different number ones with two-week reigns for Adolescence and 28 Days Later; H1 2026 shows 24 different number ones with Spider-Noir as the only two-week reign. A legend maps services to colors, and a dot marker denotes titles whose first-ever week on the chart was at number one. Source: Reelgood Weekly Streaming Top 10, US.
Insights and Trends

Streaming’s #1 Spot Is a Revolving Door: A Week at the Top Measures Launch, Not Demand

In 79 weeks of Reelgood’s overall Streaming Top 10, no title has held #1 for three consecutive weeks. Of 69 reigns at the top,…
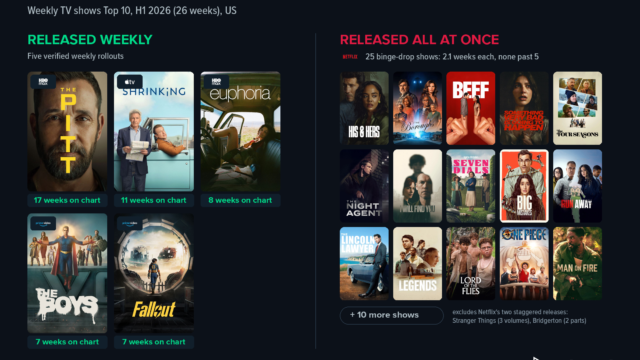
Graphic titled Released weekly, a show holds the chart for its whole season, split into two zones by release model. The released-weekly zone shows five large posters, each with a service logo chip (HBO Max on The Pitt and Euphoria, Apple TV on Shrinking, Prime Video on The Boys and Fallout) and week badges: The Pitt at 17 weeks, Shrinking at 11, Euphoria at 8, The Boys at 7, and Fallout at 7. The released-all-at-once zone, led by the Netflix logo and showing its 25 binge-drop shows at 2.1 weeks each with none past 5, has a wall of 15 small posters including His & Hers, The Boroughs, Beef, The Four Seasons, and The Night Agent, a chip reading plus 10 more shows, and a note that Netflix's two staggered releases, Stranger Things (3 volumes) and Bridgerton (2 parts), are excluded. Source: Reelgood Weekly Streaming Top 10, US.
Insights and Trends

Binge Buys a Week. Weekly Buys a Season: What Release Strategy Does to Top 10 Staying Power

Netflix put 27 different shows on Reelgood’s weekly TV Top 10 in the first half of 2026, almost twice as many as any other…

A search results interface showing a query for "crime dramas" returning three titles, The Shawshank Redemption, The Godfather, and Breaking Bad, each marked "Found" with their real genre and tag metadata displayed. A fourth title sits in a dashed panel marked "Missing," live on three platforms but excluded from results because it has no genre or tags on file.
Insights and Trends

Content Discoverability Isn’t a Recommendation Problem. It’s a Metadata Problem.

A streaming platform can rebuild its entire browse and recommendation experience and still leave viewers unable to find what they’re looking for. That’s because…
Graphic titled Two ways to win the Top 10, many titles briefly or a few for months, split into two labeled zones. The Netflix zone, labeled the volume game with 66 spots from 37 titles at about 1.8 weeks each, shows a grid of 15 title posters including The Boroughs, Remarkably Bright Creatures, The Crash, His & Hers, Beef, Bridgerton, and The Night Agent, with a chip reading plus 22 more titles. The HBO Max zone, labeled the staying power game with 48 spots from 15 titles at 3.2 weeks each, shows five larger posters with week badges: The Pitt at 15 weeks, Euphoria at 7, A Knight of the Seven Kingdoms at 6, One Battle After Another at 5, and If I Had Legs I'd Kick You at 2. Source: Reelgood Weekly Streaming Top 10, US.
Insights and Trends

Which Streamers Own the Top 10? Netflix Leads on Volume, HBO Max on Staying Power

Netflix needed 37 different titles to hold its 66 weekly Top 10 spots in the first half of 2026, more than any other service.…
Chart titled "Missed Opportunities" comparing two movies side by side. Left: Project Hail Mary poster, labeled "#1 Box Office," with screenwriter Drew Goddard and book author Andy Weir listed. Right: The Martian poster, labeled "Not Streaming." Reelgood logo and source line "Source: Reelgood catalog data, March 2026" at the bottom.
Insights and Trends

When Project Hail Mary Hit #1, The Martian Wasn’t Streaming: Content Intelligence Takeaways for Streaming Marketers

When Project Hail Mary hit theaters and climbed to the top of the box office, the obvious follow-up watch was The Martian. Same author,…
Full ranking table from Reelgood's Streaming Service Popularity Index for June 24 to July 24, 2026, listing 19 US streaming services by rank, average titles in the US Top 100, Streaming Ranking Index score (0-10), and month-over-month change. Netflix ranks first at 9.78, followed by Prime Video at 8.82 and HBO Max at 7.23.
Insights and Trends

Introducing the Streaming Service Popularity Index: Who’s Actually Carrying Streaming’s Demand

Netflix holds an average of 34.2 titles in the US Top 100 movies and shows at any given time. Philo holds 23.6, a smaller…
Scatter chart titled "Every UK Streaming Platform Has a Different Content Personality" plotting genre variety on the vertical axis against narrative tag variety on the horizontal axis for select streaming platforms in the UK. The vertical axis runs from Genre Specialist at the bottom to Genre Generalist at the top. The horizontal axis runs from Theme Specialist on the left to Theme Generalist on the right. Four quadrants are labelled Diverse Curators, Everything Everywhere, Focused Storytellers, and Genre Encyclopedias. In the Diverse Curators quadrant: Channel 5 and BBC iPlayer. In the Everything Everywhere quadrant: ITVX, Prime Video, and NOW. Near the centre on the theme specialist side: Disney+ and Netflix. In the Genre Encyclopedias quadrant: Paramount+ and HBO Max. In the Focused Storytellers quadrant: Channel 4 and U. Footnote reads that the chart is based on distribution of top-3 genres and top-4 tags per title, including movies and TV series, from the Reelgood content streaming dataset as of July 2026.
Insights and Trends

How Alike Are UK Streaming Platforms? Genre vs. Tag Similarity Compared

A crime drama about a small-town investigation and a crime drama about corporate corruption share a genre and almost nothing else. Tags are where…

Get Streaming Industry Insights in your inbox

Weekly rankings, industry analysis, and product updates. No spam.