Streaming Exclusives Now Come With an Expiration Date. Here’s What Catalog Teams Should Plan For.
Key takeaways
- Paramount owns Star Trek, yet in September 2026, 136 of the franchise’s 264 US subscription and ad-supported streaming windows were on 19 services Paramount doesn’t own.
- The share of US streaming titles on three or more services rose from 9% in 2020 to 21% in 2025, according to Ampere Analysis.
- Exclusivity is now a choice each owner makes: no major rival carries more than 4% of Netflix’s US movies or shows, while Paramount licenses even Star Trek.
- In the first half of 2026, weekly-release hits like The Pitt (17 weeks) and Shrinking (11) held Reelgood’s TV Top 10 longer than any Netflix show. None of Netflix’s 27 charting shows lasted more than 5 weeks.
- Rights teams can catch titles that stay up after a window ends by checking daily availability against the contract dates they already hold.
Paramount owns Star Trek. But just over half of the franchise’s US streaming windows are on services Paramount doesn’t own.
In Reelgood’s Star Trek availability analysis, 19 services outside Paramount held 136 of the franchise’s 264 subscription and ad-supported windows in September 2026. Paramount+ and Pluto TV, Paramount’s free streaming service, held the other 128. Even Paramount licenses Star Trek widely.
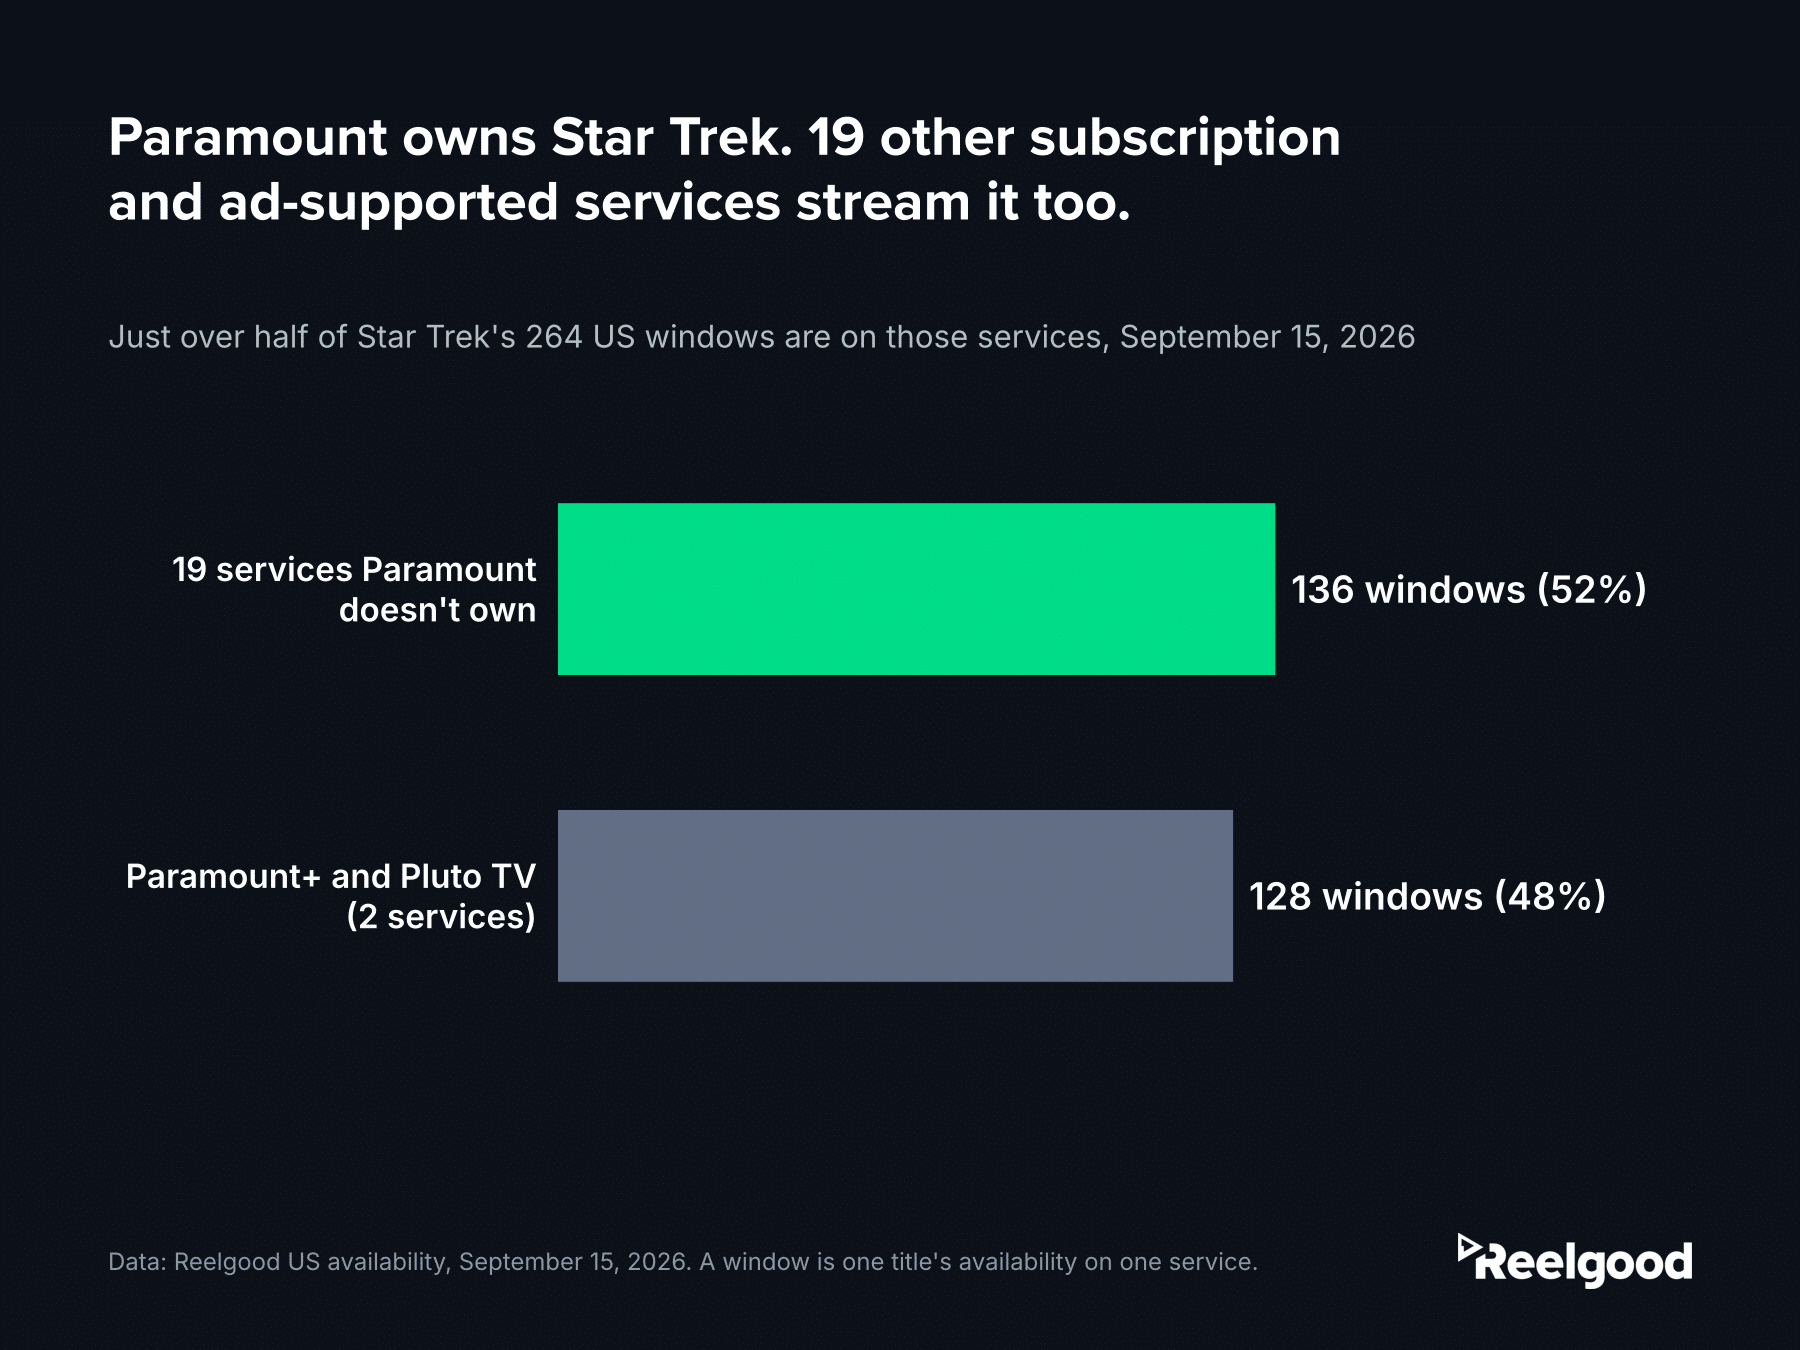
Paramount’s two services average 64 Star Trek windows each; the 19 others average about 7. Paramount keeps the depth and licenses out the breadth. Data: Reelgood US availability, September 15, 2026.
Reelgood’s data records when each title arrives on and leaves a streaming service, by country, dated to the day.
We asked the Reelgood team, the data scientists, engineers and analysts who work with that data across 300+ services, what’s changing most in how services manage and compete on catalog. The short version:
Content is being treated less like a moat and more like inventory to be priced, rotated and re-licensed.
Exclusive titles are becoming co-exclusive and rotating
Exclusive licensing is giving way to shared windows, and three team members named it as the biggest catalog change they expect.
Daniela Velasco, Lead Data Analyst, expects co-exclusivity to become a common catalog strategy, with services licensing previously exclusive titles to competitors so the same content runs on several platforms at once. “The shift is driven by the need to better monetize catalogs,” she said.
Diego Suarez, Data Analyst, sees the same motive. “The time when companies were over possessive with their original content is long gone,” he said. In his view, companies will start treating content “as what they are: financial assets.” Andres Fuertes Ruiz, Data Engineer, expects services to “rotate hits between different apps” and rent shows to rivals.
The market already looks like this.
According to Ampere Analysis, 39% of US streaming titles appeared on two or more services in July 2025, and the share on three or more rose from 9% in 2020 to 21% in 2025. Ampere pointed to co-exclusive deals between Netflix and HBO, and between Disney and AMC, as evidence that premium content gets shared too.
For licensing teams, a title’s value now depends on where else it’s running.
A co-exclusive window on a title that’s already streamed on two rivals is a different asset than a true exclusive, and pricing the two the same way means overpaying.
What shorter windows mean for buyers
Pablo Lucio Paredes, Head of Engineering and Data, expects licensing windows to get shorter. That gives viewers a reason to watch a title now instead of adding it to a watchlist, he said, but it will “put licensing teams in those companies under more pressure to find more content to replace” what leaves.
Recent deals show how short a window can be. In January, Amazon MGM licensed four James Bond films to Netflix for a three-month period, Variety reported, along with select Rocky and Creed films. Amazon’s head of worldwide distribution, Chris Ottinger, told TheWrap that Amazon always planned to keep licensing MGM’s library to partners.
When windows are short, how long a title holds attention inside one matters more.
Reelgood’s release-strategy analysis looked at five weekly-release hits from the first half of 2026: The Pitt, Shrinking, Euphoria, The Boys and Fallout. Each stayed on the weekly TV Top 10 for 7 to 17 weeks, led by The Pitt at 17. Netflix put 27 shows on the chart in the same period. They averaged 2.1 weeks, and none lasted more than 5, the longest being His & Hers and The Boroughs.
Marina Germani, QA and Data Entry Analyst, pointed out that releasing seasons in parts or weekly has worked for platforms. “It’s kind of a return to the old days when people would wait at night for new episodes,” she said.
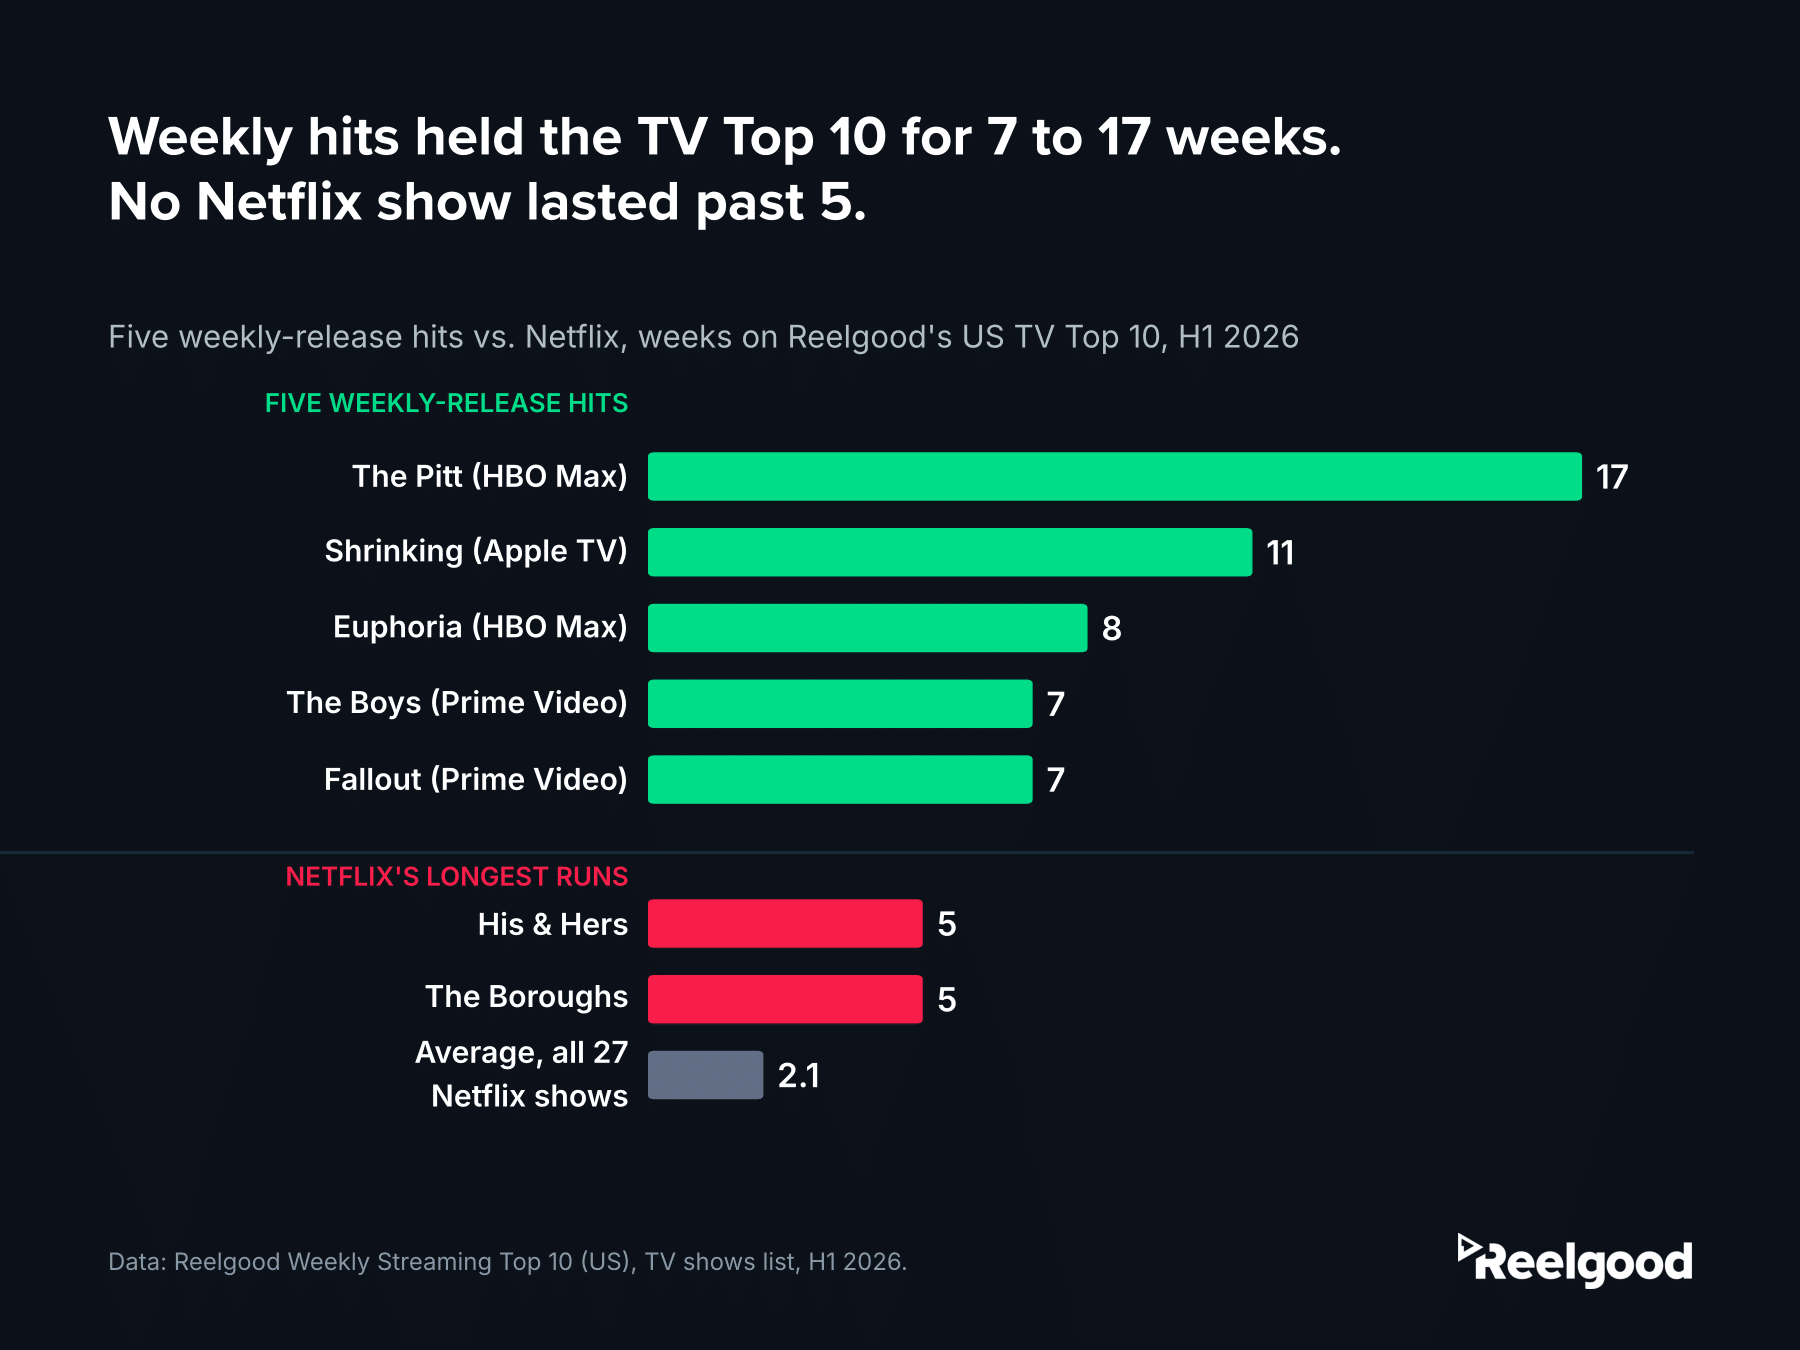
Five weekly-release hits, led by The Pitt (17 weeks), held Reelgood’s TV Top 10 for 7 to 17 weeks in H1 2026; none of Netflix’s 27 charting shows lasted more than 5. Data: Reelgood Weekly Streaming Top 10 (US).
For a buyer weighing a three-month window, a show that holds the Top 10 for 17 weeks and one that drops off after two are different deals.
A shorter window also means an earlier search for a replacement, so licensing teams need to know what’s leaving rival catalogs and what’s newly available week to week, not only at renewal time. Top 10 weeks reflect sustained interest from Reelgood users, not total viewing.
Regional catalogs are being tuned market by market
Services are moving from one catalog per platform toward catalogs adjusted for each market.
Liseth Mina Rosero, Data Entry Specialist and QA, expects services to get much more flexible with regional availability. “Instead of one global catalog, they’ll customize what’s available based on local trends and where they’re losing subscribers,” she said. Catalog teams will need to “move faster, track real-time data, and shift titles around quickly to stay competitive and keep people from canceling.”
Damien Capocchi, Backend Engineering Manager, sees a pull the other way for licensed content. He expects more services to work toward global availability of third-party titles, where culturally appropriate, “to keep a more consistent offering across regions.”
Both can be true at once. Ampere Analysis reported in December 2025 that SVOD catalog growth is increasingly driven by deals with local broadcasters and a bigger focus on local content, particularly at Netflix, Prime Video and Disney+. A service can buy global rights to a licensed franchise and still run a different local slate in every country, so distribution teams have to read a title’s availability market by market.
Exclusivity is now a choice, not the default
Not everyone on the team expects exclusivity to fade. Carolina Tinajero, on the Data Entry team, expects more services to lock up big titles to keep customers engaged, because “prices are going up and people are no longer subscribing to several services like before.” Felipe Lemarie, Data Science Lead, expects a flood of cheap content to make high-quality shows rarer, and he thinks those rare shows are what will drive users and retention.
Owners are making different calls. Ampere’s analysis found that originals and flagship franchises drive subscriber retention, while the long tail of a catalog is freer to license elsewhere. Netflix has kept its catalog largely to itself: in our Netflix catalog overlap analysis, no major rival carried more than 4% of Netflix’s US movies or shows. Paramount licenses even Star Trek.
For acquisition teams, that makes the owner part of the price. Before paying for exclusivity, look at how the owner has handled its other titles. Window history shows whether you’re buying from a company that keeps its catalog close or one that rotates it.
What should catalog and distribution teams change?
Catalog planning has to run continuously, because the market now does. Daniela put it plainly:
“Windowing, availability, and rights tracking will move from static planning exercises to continuously optimized systems.”
Diego made the same point from the operations side: distribution teams “will no longer manage a catalog manually,” and will need a system that tracks real-time availability against licensing fees.
In practice, that means three changes:
- Before pricing a deal, pull the title’s full window history across services and markets, not just where it streams today. You’ll know whether you’re buying an exclusive or the fourth stop in a rotation.
- To confirm a window has closed, compare daily availability against the contract dates you already hold instead of relying on spot checks or a partner’s email. That’s how rights teams catch a title that stayed up after its window ended, as our rights windows post describes.
- Track what’s arriving on and leaving rival catalogs every week, not once a quarter, so the replacement titles Pablo described are lined up before they’re needed.
Reelgood’s daily historical availability data shows content acquisition and licensing teams when titles arrived, left and moved between services, dated to the day. It covers 300+ services in 25+ countries, with history going back up to 7 years, depending on geography.
See the window history for your titles
If your team is planning around shorter windows or more shared catalogs, we can show you what the data looks like for the titles you care about. Email data@reelgood.com or use our data request form, which covers daily availability history as well as metadata, and tell us what you need:
- If you license, acquire or sell titles: the window history for the titles or franchises you’re evaluating, across services and markets.
- If you manage rights: daily availability for a set of titles, to check against the window dates you hold.
- If you run strategy or competitive analysis: what’s arriving on and leaving the rival catalogs you track.
Data: Reelgood Movie & TV Metadata & Streaming Availability Database (US). Star Trek windows from Reelgood’s Star Trek availability analysis, as of September 15, 2026, counting subscription and ad-supported windows; a window is one title’s availability on one service. Catalog overlap from Reelgood’s Netflix catalog overlap analysis. Release-strategy figures from the Reelgood Weekly Streaming Top 10 (US), TV shows list, first half of 2026, built on real-time, first-party data from interactions by Reelgood users in the US; weekly-release shows are the five covered in Reelgood’s release-strategy analysis, and Netflix figures cover all 27 Netflix shows that charted. Multi-service share from Ampere Analysis, September 2025. Team quotes come from an internal Reelgood survey and are lightly edited for clarity.
