Posts Tagged ‘content distribution’
What Streaming Buyers Are Actually Acquiring: How to Read Catalog Changes for Licensing and Sales
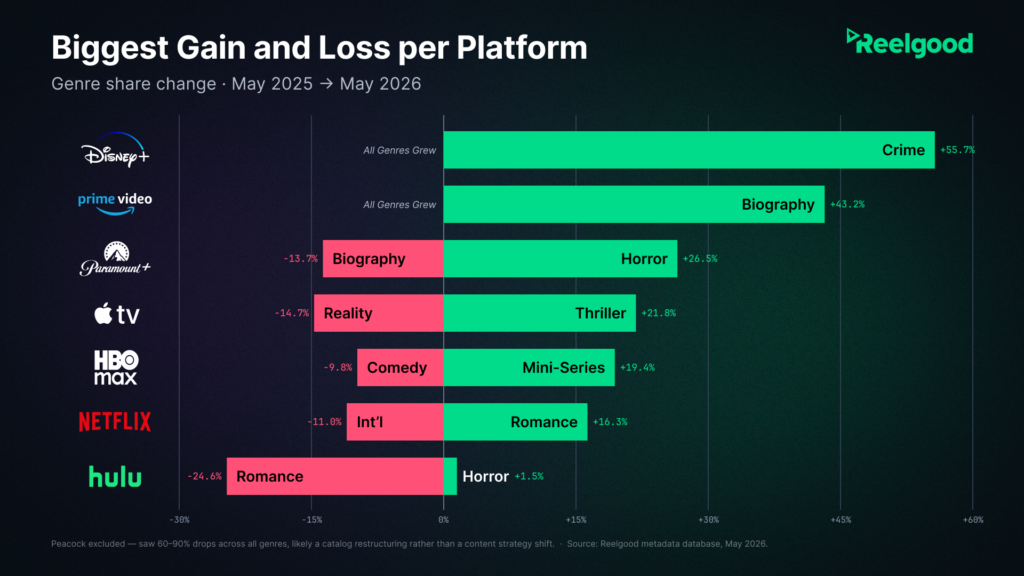
Over the past few months I have sat in on a string of conversations with content strategy, acquisition, and sales leaders at production companies and independent distributors. The companies could not have been more different: a Canadian studio selling scripted series into Europe, a mid-size studio building a slate for underrepresented audiences, an indie distributor…
Read MoreThe Distribution Arc: How Long Does It Take a Hit Film to Go Free?
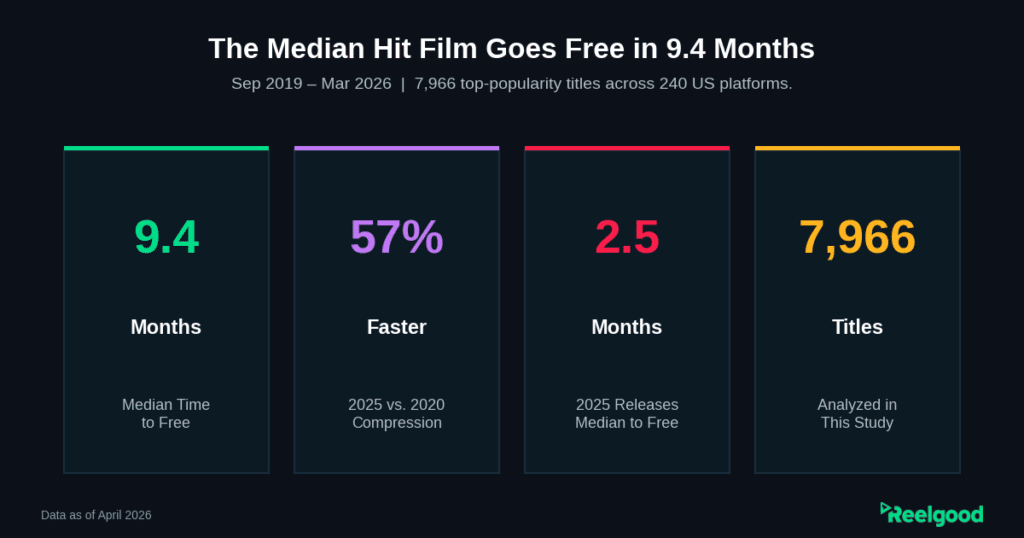
Reelgood analyzed 1.93 million availability windows across 240 platforms (US market) to quantify the streaming industry’s best-kept open secret: the windowing clock is accelerating, and the data tells a different story than most licensing teams assume. Key Takeaways The median time from a popular movie’s first paid availability to its first free/AVOD appearance is 9.4…
Read More