How Alike Are UK Streaming Platforms? Genre vs. Tag Similarity Compared
A crime drama about a small-town investigation and a crime drama about corporate corruption share a genre and almost nothing else. Tags are where that difference lives, and it’s why genre-only comparisons miss so much of what’s actually distinctive about a catalogue.
Reelgood tracks real-time and historical streaming availability and metadata across most platforms in a growing number of markets – this is what that data can show.
Key Takeaways: UK Streaming Platform Similarity by the Numbers
- A full picture of the market needs more than one lens. Genre and tag breadth show how varied each platform is on its own; tag similarity shows how much two platforms actually overlap. Neither alone tells the full story; together they explain findings that would otherwise look contradictory.
- Applied to the two live UK streaming stories: Sky’s NOW and ITV’s ITVX are both broad, unfocused catalogues. Directly compared, they’re nearly identical, more alike than almost any other pair observed. BBC iPlayer and Channel 4 are shaped differently, and only moderately alike. A partnership there would widen the combined slate rather than thicken it. The data independently surfaced Channel 4’s closest match as U, a BBC Studios’ brand Channel 4 already carries.
- Corporate ownership doesn’t reliably predict content overlap either: Paramount Skydance owns both Channel 5 and Paramount+, yet the two rank only middling in similarity, while Netflix and Prime Video, direct rivals under separate owners, are the most alike pair in the entire set.
Reelgood’s genre and tag (sub-genre) data covers streaming platforms with one consistent taxonomy, which makes it possible to ask questions that are normally hard to answer well:
How varied is any one platform’s catalogue, and how similar is it to other platforms in the market?
We ran that comparison across a select set of 11 UK platforms, all 55 possible pairings. The pattern that comes back says as much about how to read a merger as it does about the platforms themselves.
Variety vs. Similarity: Two Ways to Measure How Streaming Platforms Compare
Variety asks how evenly a single platform’s catalogue spreads across genres and tags: generalist versus specialist. That’s what a positioning map shows for each platform on its own.
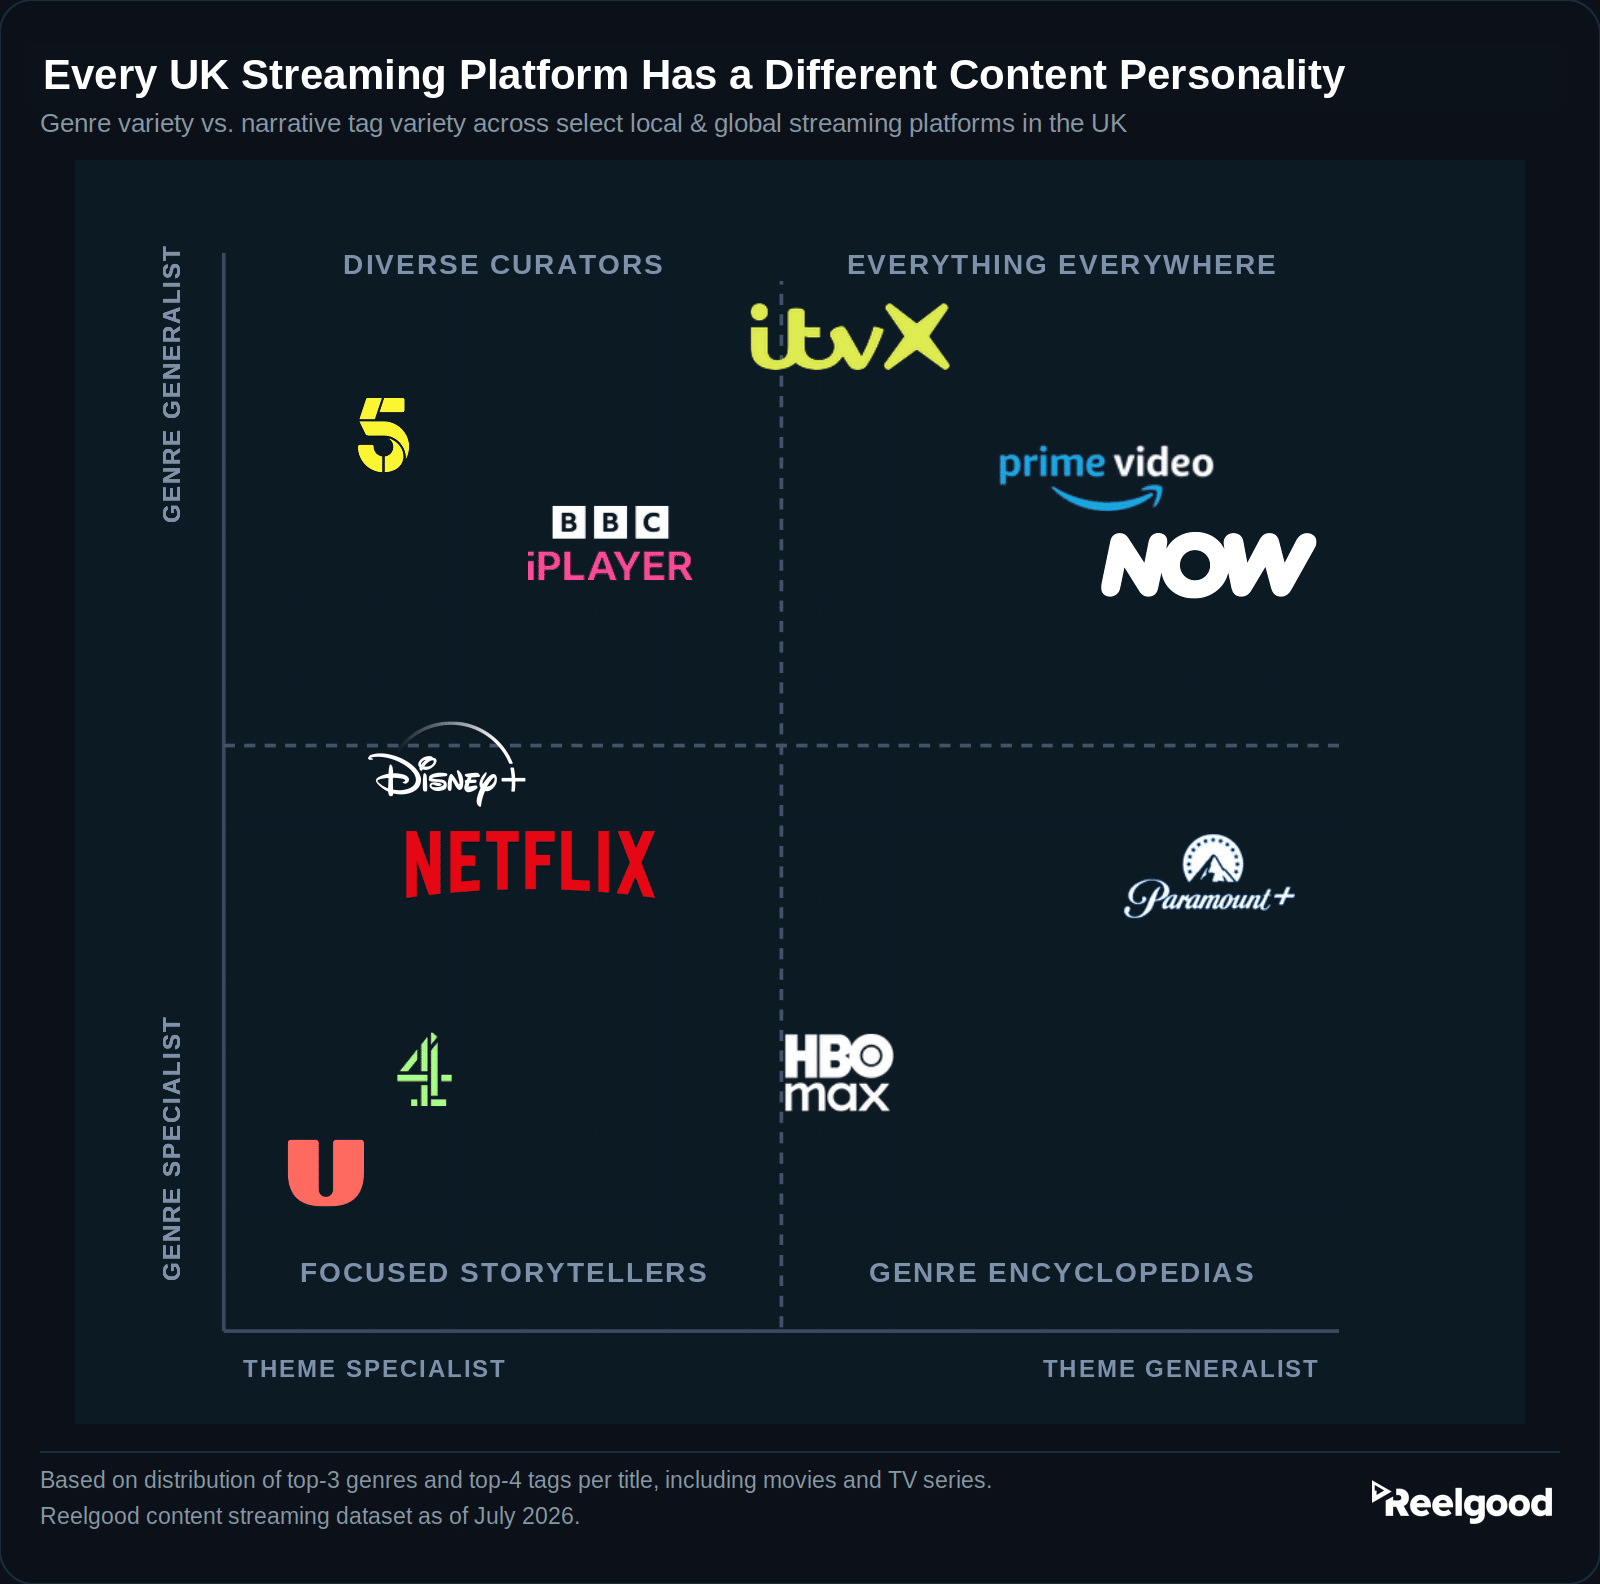
Genre variety alone wouldn’t tell you much here. Every platform looks reasonably varied on that axis by itself.
It’s adding tag variety, the layer beneath the genre label, that turns a flat picture into an insightful one.
Similarity asks something different: compare two platforms directly, and how much do their actual top genres and tags have in common? Two generalists can still share almost nothing. Two specialists can turn out to specialise in exactly the same thing. Variety describes a single platform’s shape; similarity describes the distance between two shapes. That distinction matters:
Two platforms can each have a wide range of themes and still share almost none of the same ones.
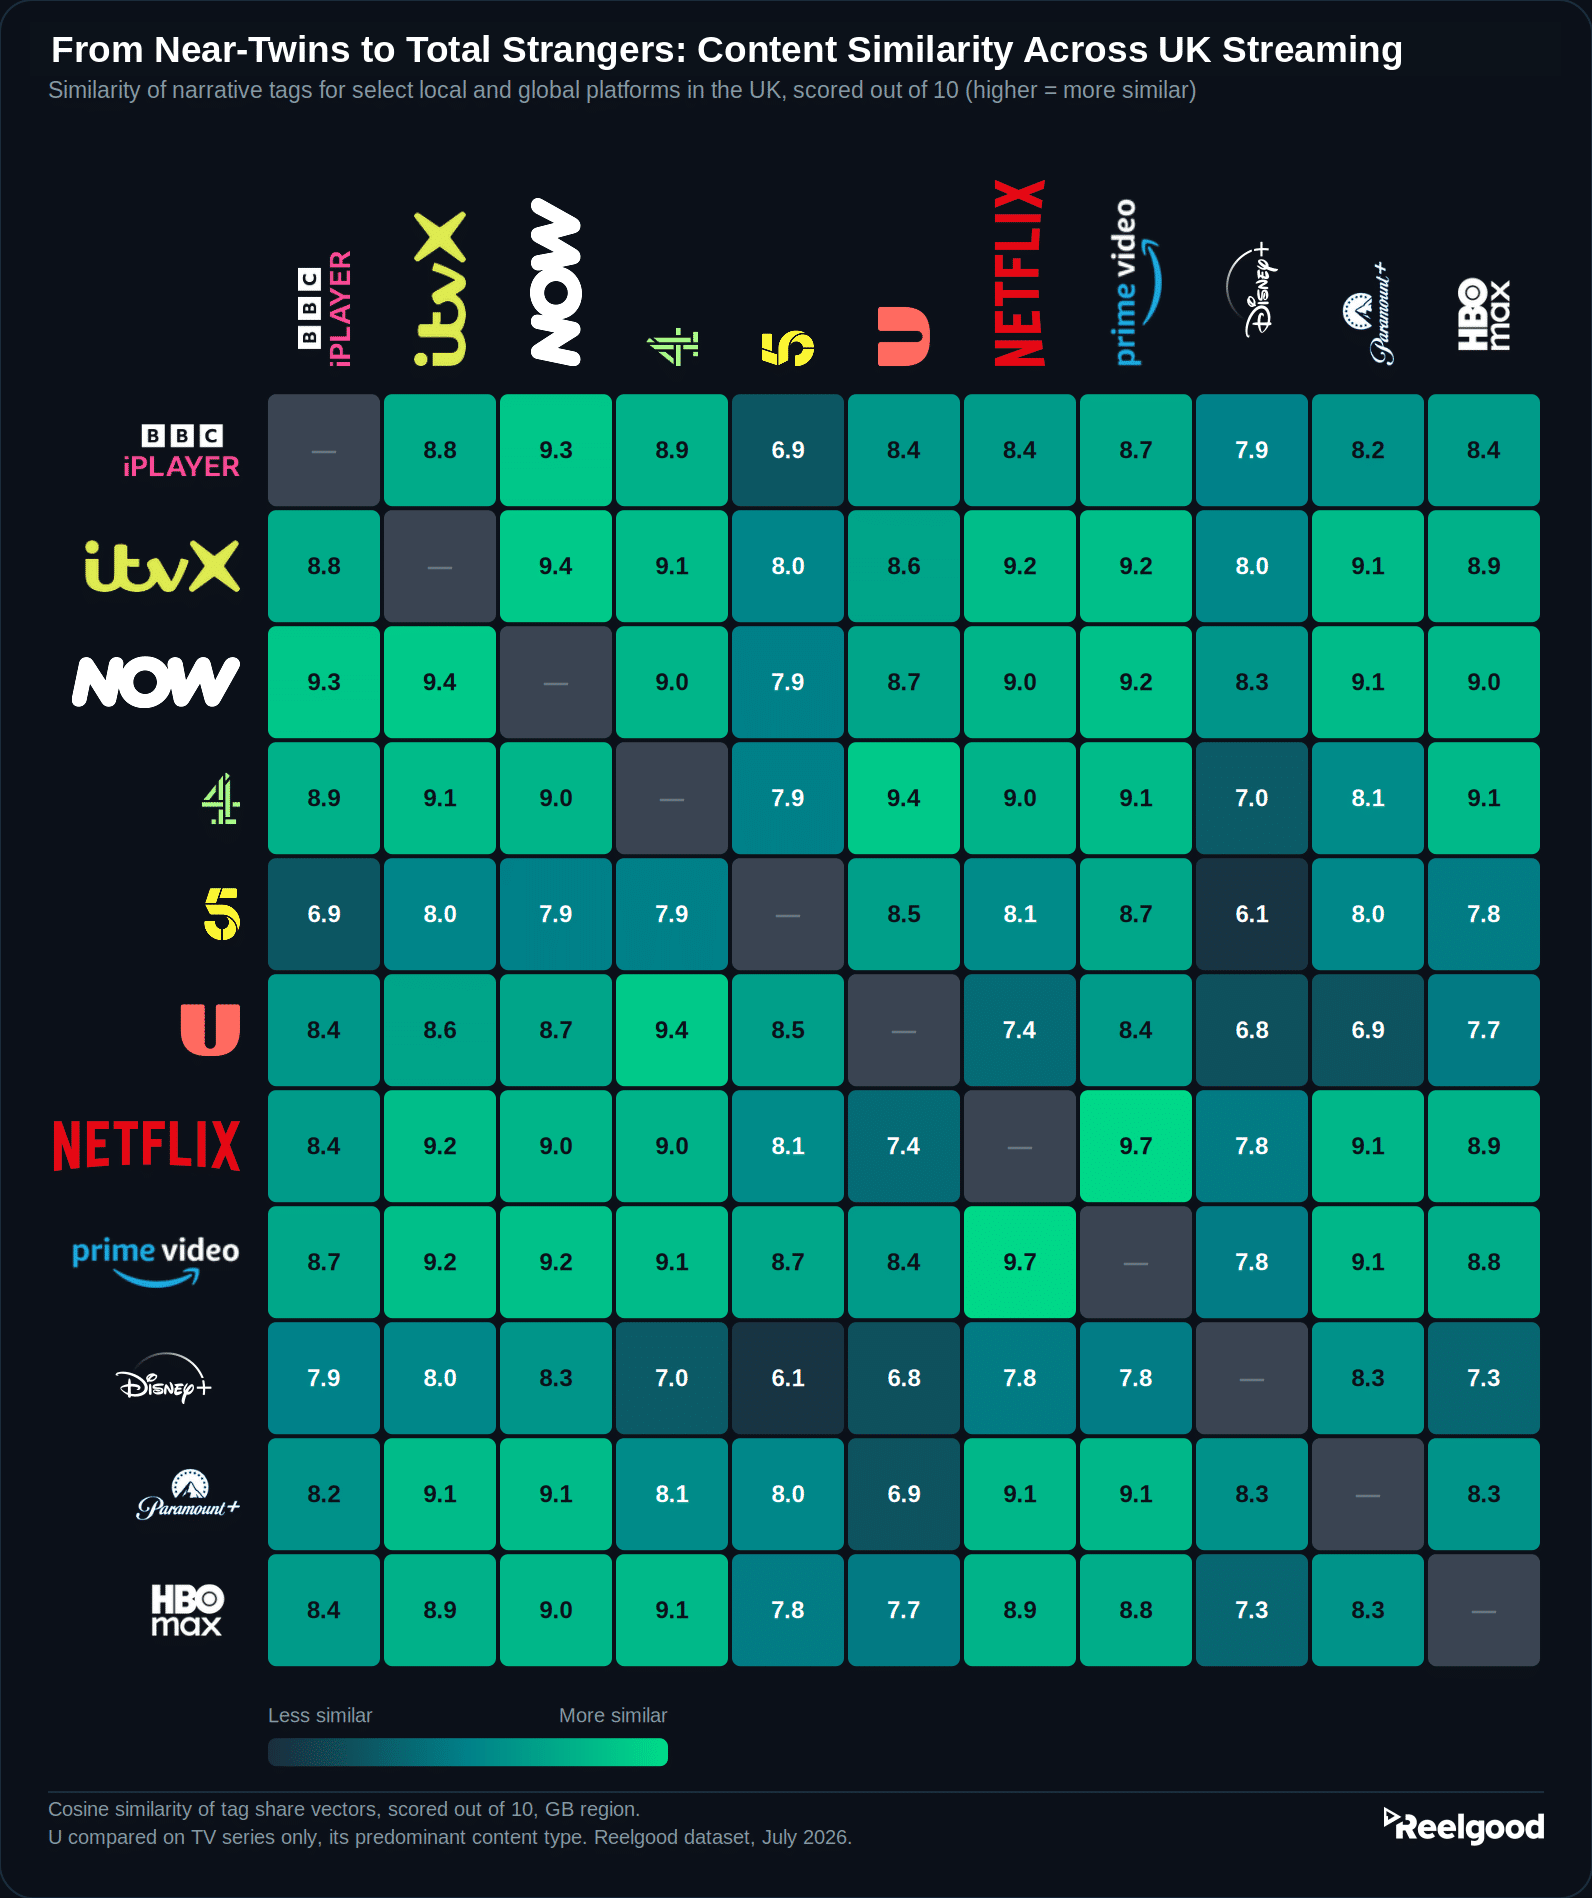
Here we focus on tag similarity: it’s the layer that actually separates platforms, where genre alone tends to lump very different services together.
We see a related pattern in other markets: the thematic composition of the US Top 10 shifted substantially year over year while the genre mix stayed comparatively stable.
Tags are often where movement shows up first, before genre catches up.
How the Sky-ITV and BBC-Channel 4 Deals Compare by Content Similarity
Two announcements landed in the UK two days apart in July:
- On July 6, Comcast-owned Sky agreed to acquire ITV Media & Entertainment, including ITVX, for a total consideration of up to £1.6 billion.
- On July 8, new BBC director general Matt Brittin told the Commons Culture, Media and Sport Committee that Channel 4 had approached the BBC about integrating its content into iPlayer, partly in response to Channel 4 now “looking very sub-scale“ in the light of the Sky-ITV merger.
NOW and ITVX: A Scale Play
Sky’s NOW and ITVX land in the same quadrant on the variety map, and compared directly, they’re closer than almost any pair observed. Tag similarity is 9.4 out of 10, the second highest of the 55 pairings.
Content similarity is an asset here.
Sky is acquiring an established AVOD business, an advertising operation, and 16.5 million monthly digital users: that certainly adds new audience, content volume and pure advertising revenue alongside Sky’s existing subscription and hybrid mix. But it doesn’t result in a wider narrative range.
There are no competing creative identities to reconcile, and overlapping audiences are easier to sell to advertisers as one proposition. Sky’s own framing puts the combined business at roughly 20% of all in-home viewing in the UK, second to the BBC.
BBC iPlayer and Channel 4: A Reach Play
iPlayer and Channel 4 sit in different quadrants on the variety map, separated mainly by genre spread rather than tag. Compared directly on tag similarity, they score 8.9, ranking 15th of 55 – respectable, but well short of NOW and ITVX. A partnership between the two would produce a genuinely broader combined slate rather than more of the same.
One finding here is sharper than anything in the deal coverage so far. Channel 4’s closest observed match is U, BBC Studios’ own streaming brand: 9.4 on tag similarity – among the closest pairs in the whole set.
That’s not a coincidence.
U is owned by BBC Studios, and Channel 4 began carrying its library in January 2026.
In that sense, a partnership between BBC and Channel 4 would formalise a content relationship that’s already live: part of the BBC’s catalogue is already inside Channel 4’s platform, one layer beneath the conversation happening at select-committee level. The map recovers that connection without being told about it, which is the beauty of this exercise.
The chart below breaks both pairs down to the genre and tag level: how similar NOW and ITVX’s catalogues genuinely are versus how new BBC iPlayer and Channel 4’s would be to each other.
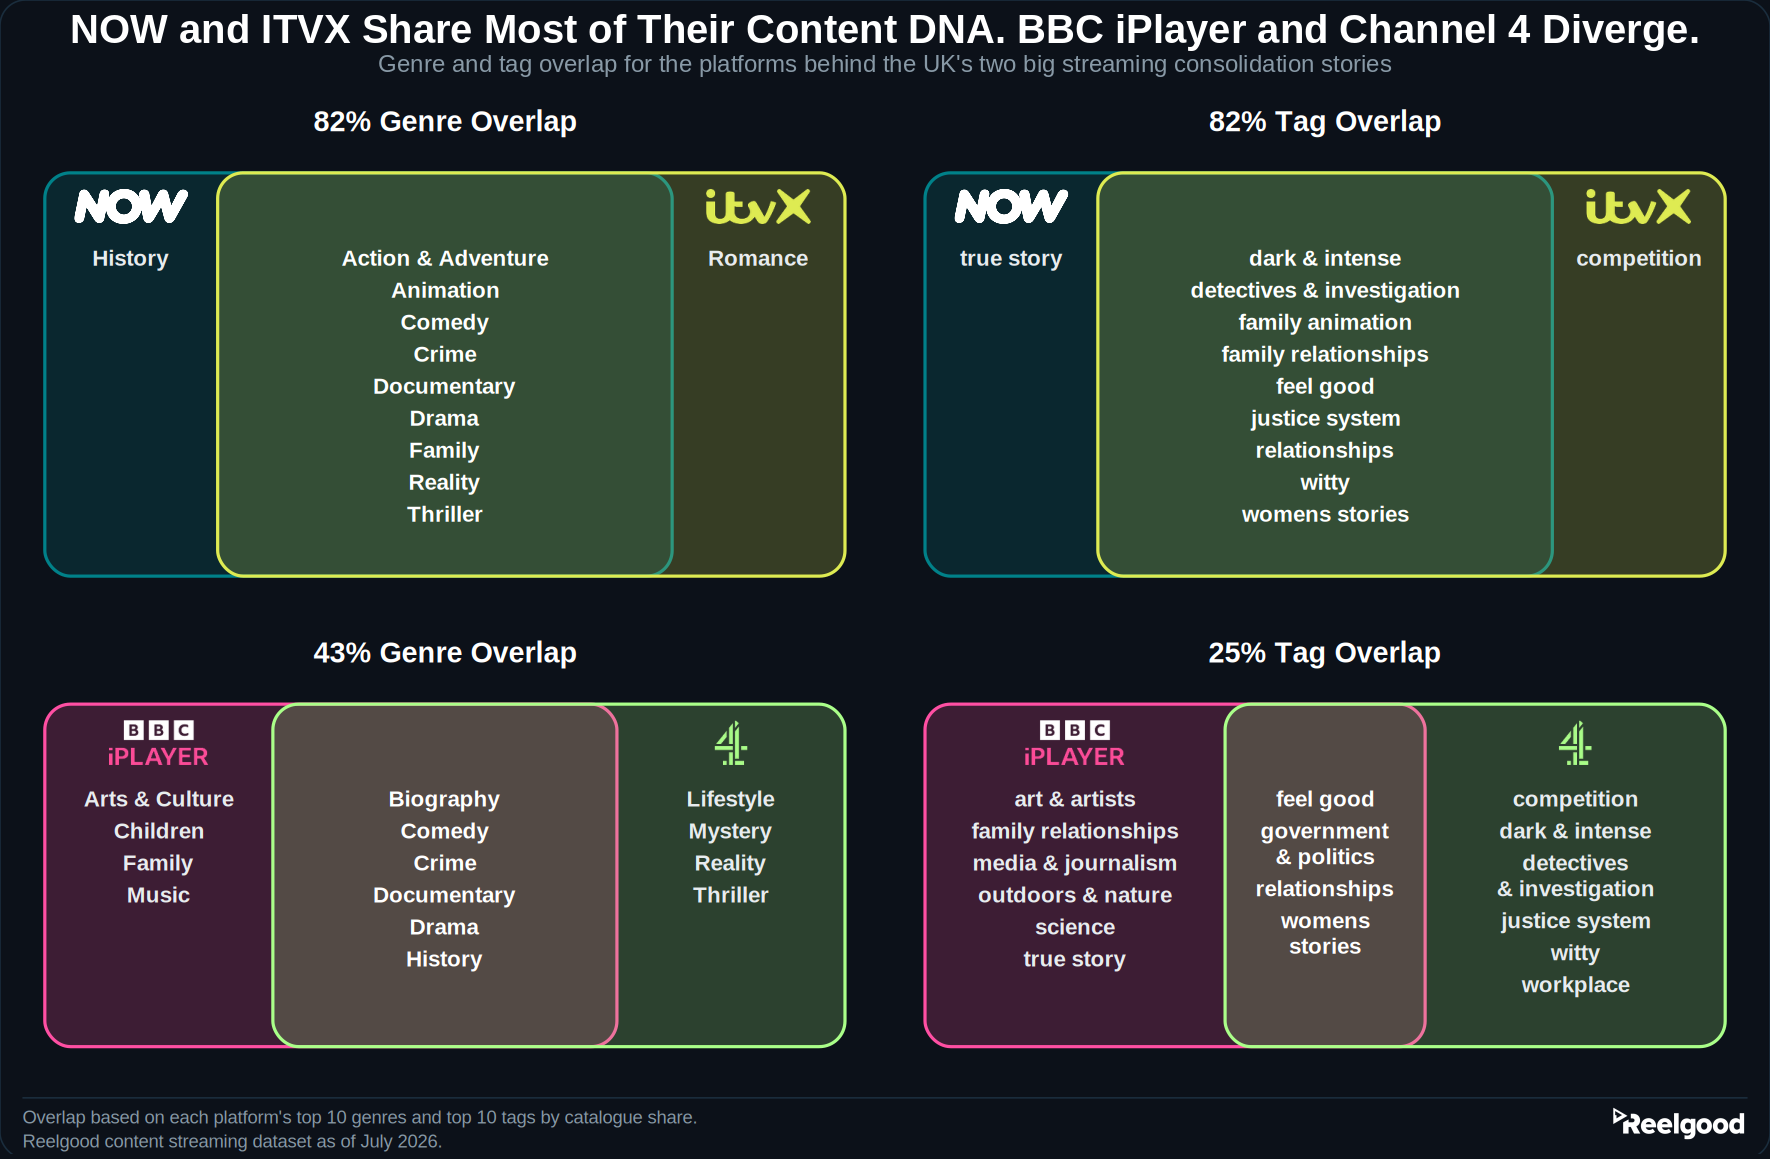
More UK Streaming Similarity Findings: Ownership, Outliers and Overlaps
The single highest tag similarity of the 55 observed pairs: Netflix and Prime Video, at 9.7 out of 10.
Two of the biggest global competitors carrying near-identical content DNA despite competing head-on for the same subscribers.
At the other end, Disney+ and Channel 5 are the least alike pair in the selection. At 6.1. Disney+ is also, on average, the most distinct platform among those observed, the lowest average similarity to every other service in the set, reflecting its tightly curated, family-and-franchise-led catalogue against a market that otherwise skews towards broader entertainment.
Corporate ownership is worth a mention too.
Paramount Skydance owns both Channel 5 and Paramount+ in the UK. Directly compared, the two catalogues rank right in the middle of the observed field in similarity. That’s a useful position for an owner: two platforms not competing for the same audience with the same content cover more ground together than one larger catalogue would.
Netflix and Disney+ make a related point.
Both are thematic specialists, concentrated on a narrower range of tags, despite carrying two of the largest catalogues observed here:
Catalogue size and tag variety are separate properties – being big doesn’t automatically mean being broad.
Why Catalogue Composition Matters More Than Ownership Structure
For commercial, research and insights teams building competitive benchmarks, that’s the practical takeaway.
Ownership charts, monetisation models and subscriber counts describe market structure. Catalogue composition is a different measurement, and the two can diverge quickly.
Reelgood covers 50+ genres and 250+ tags across 6 dimensions with the same schema in every country we track, refreshed twice daily, which is what makes comparisons like this one possible in the first place. The metadata ‘Data Dictionary‘ is where to start.
Want to see this run on your own platform, or a competitor’s? Get in touch.
Data: Reelgood content streaming dataset, GB region, July 22, 2026, covering a select set of 11 UK streaming platforms (Reelgood tracks considerably more). Genre and tag distribution/variety is based on the top three genres and top four tags per title across movies and TV series (Shannon entropy method). Similarity figures are cosine similarity between platforms’ tag or genre share vectors, scored out of 10, across all 55 pairings of the 11 platforms observed, except U, which is compared on TV series only in every pairing given its catalogue composition. Similarity reflects which specific tags two platforms lean on, and how heavily, not how broad either catalogue is: a platform’s variety score and its similarity to another platform are independent measures, and a high score on one doesn’t imply anything about the other. Apple TV and MUBI were tested and excluded from both the variety map and the similarity analysis: both are highly specialised services whose inclusion widened the observed range substantially without adding proportionate insight into the platforms discussed here. The Venn diagram figures use a different, simpler method (top-10 genre and tag overlap) and won’t match the cosine similarity scores exactly, though both point the same direction.