A Third of the Top 100 Movies Were Buy-or-Rent Only in September. Some Waited Months for a Subscription Service.
On an average day between August 24 and September 24, 2026, 32 of the 100 most popular movies in the US were not on any subscription or free streaming service. The only way to watch them was to buy or rent them, almost always through Amazon and Apple TV, and usually through Fandango as well.
That was not a one-month spike. In every 30-day window since May, between 30.8 and 36.5 of the Top 100 movies were buy-or-rent only on an average day. That is more than twice the number of Top 100 movies on any one of the 20 services in Reelgood’s popularity index.
Part of that is the usual stretch between a film’s digital release and its first subscription deal. What the daily record adds is how long that stretch runs while the demand is visible. For films that spent at least two straight weeks in the Top 100 as buy-or-rent titles and then reached a subscription service while still in it, the median measurable wait was about six weeks, and September’s arrivals ranged from 36 days to 102.
Some of those films have been popular for months. Hokum has been in the Top 100 every day since June 2, as high as third among movies, and on none of those 115 days through September 24 was it on a subscription or free service. For anyone acquiring films for a subscription service, or building a “where to watch” feature, that is nearly four months of Top 100 demand with no subscription option on any day of it.
The data comes from the daily US Top 100 behind Reelgood’s Streaming Service Popularity Index: the 100 most popular movies and 100 most popular shows, based on title popularity across the Reelgood app’s user base, with every service carrying each title that day. The September ranking of all 20 services is below and on the index page.
Key takeaways
- On an average day from August 24 to September 24, 2026, 32 of the US Top 100 movies were available only to buy or rent.
- That share has held in every 30-day window since May, at 30.8 to 36.5 movies a day. Shows are the opposite: fewer than two of the Top 100 shows were buy-or-rent only on an average day.
- On September 24, 11 movies had been in the Top 100 as buy-or-rent titles for 40 or more days in a row, led by Hokum at 115.
- Since early June, 37 movies moved from buy-or-rent to a subscription service while still in the Top 100, after a median measurable wait of 41 days. September’s included Star Wars: The Mandalorian and Grogu on Disney+ and In the Grey on Starz, which arrived after 102 days.
- Netflix ranked first in the Streaming Service Popularity Index for a fourth straight month, at 9.88 out of 10. Paramount+ rebounded to within one title of its June level, HBO Max held flat after two months of decline, and Disney+ rose for a third straight month.
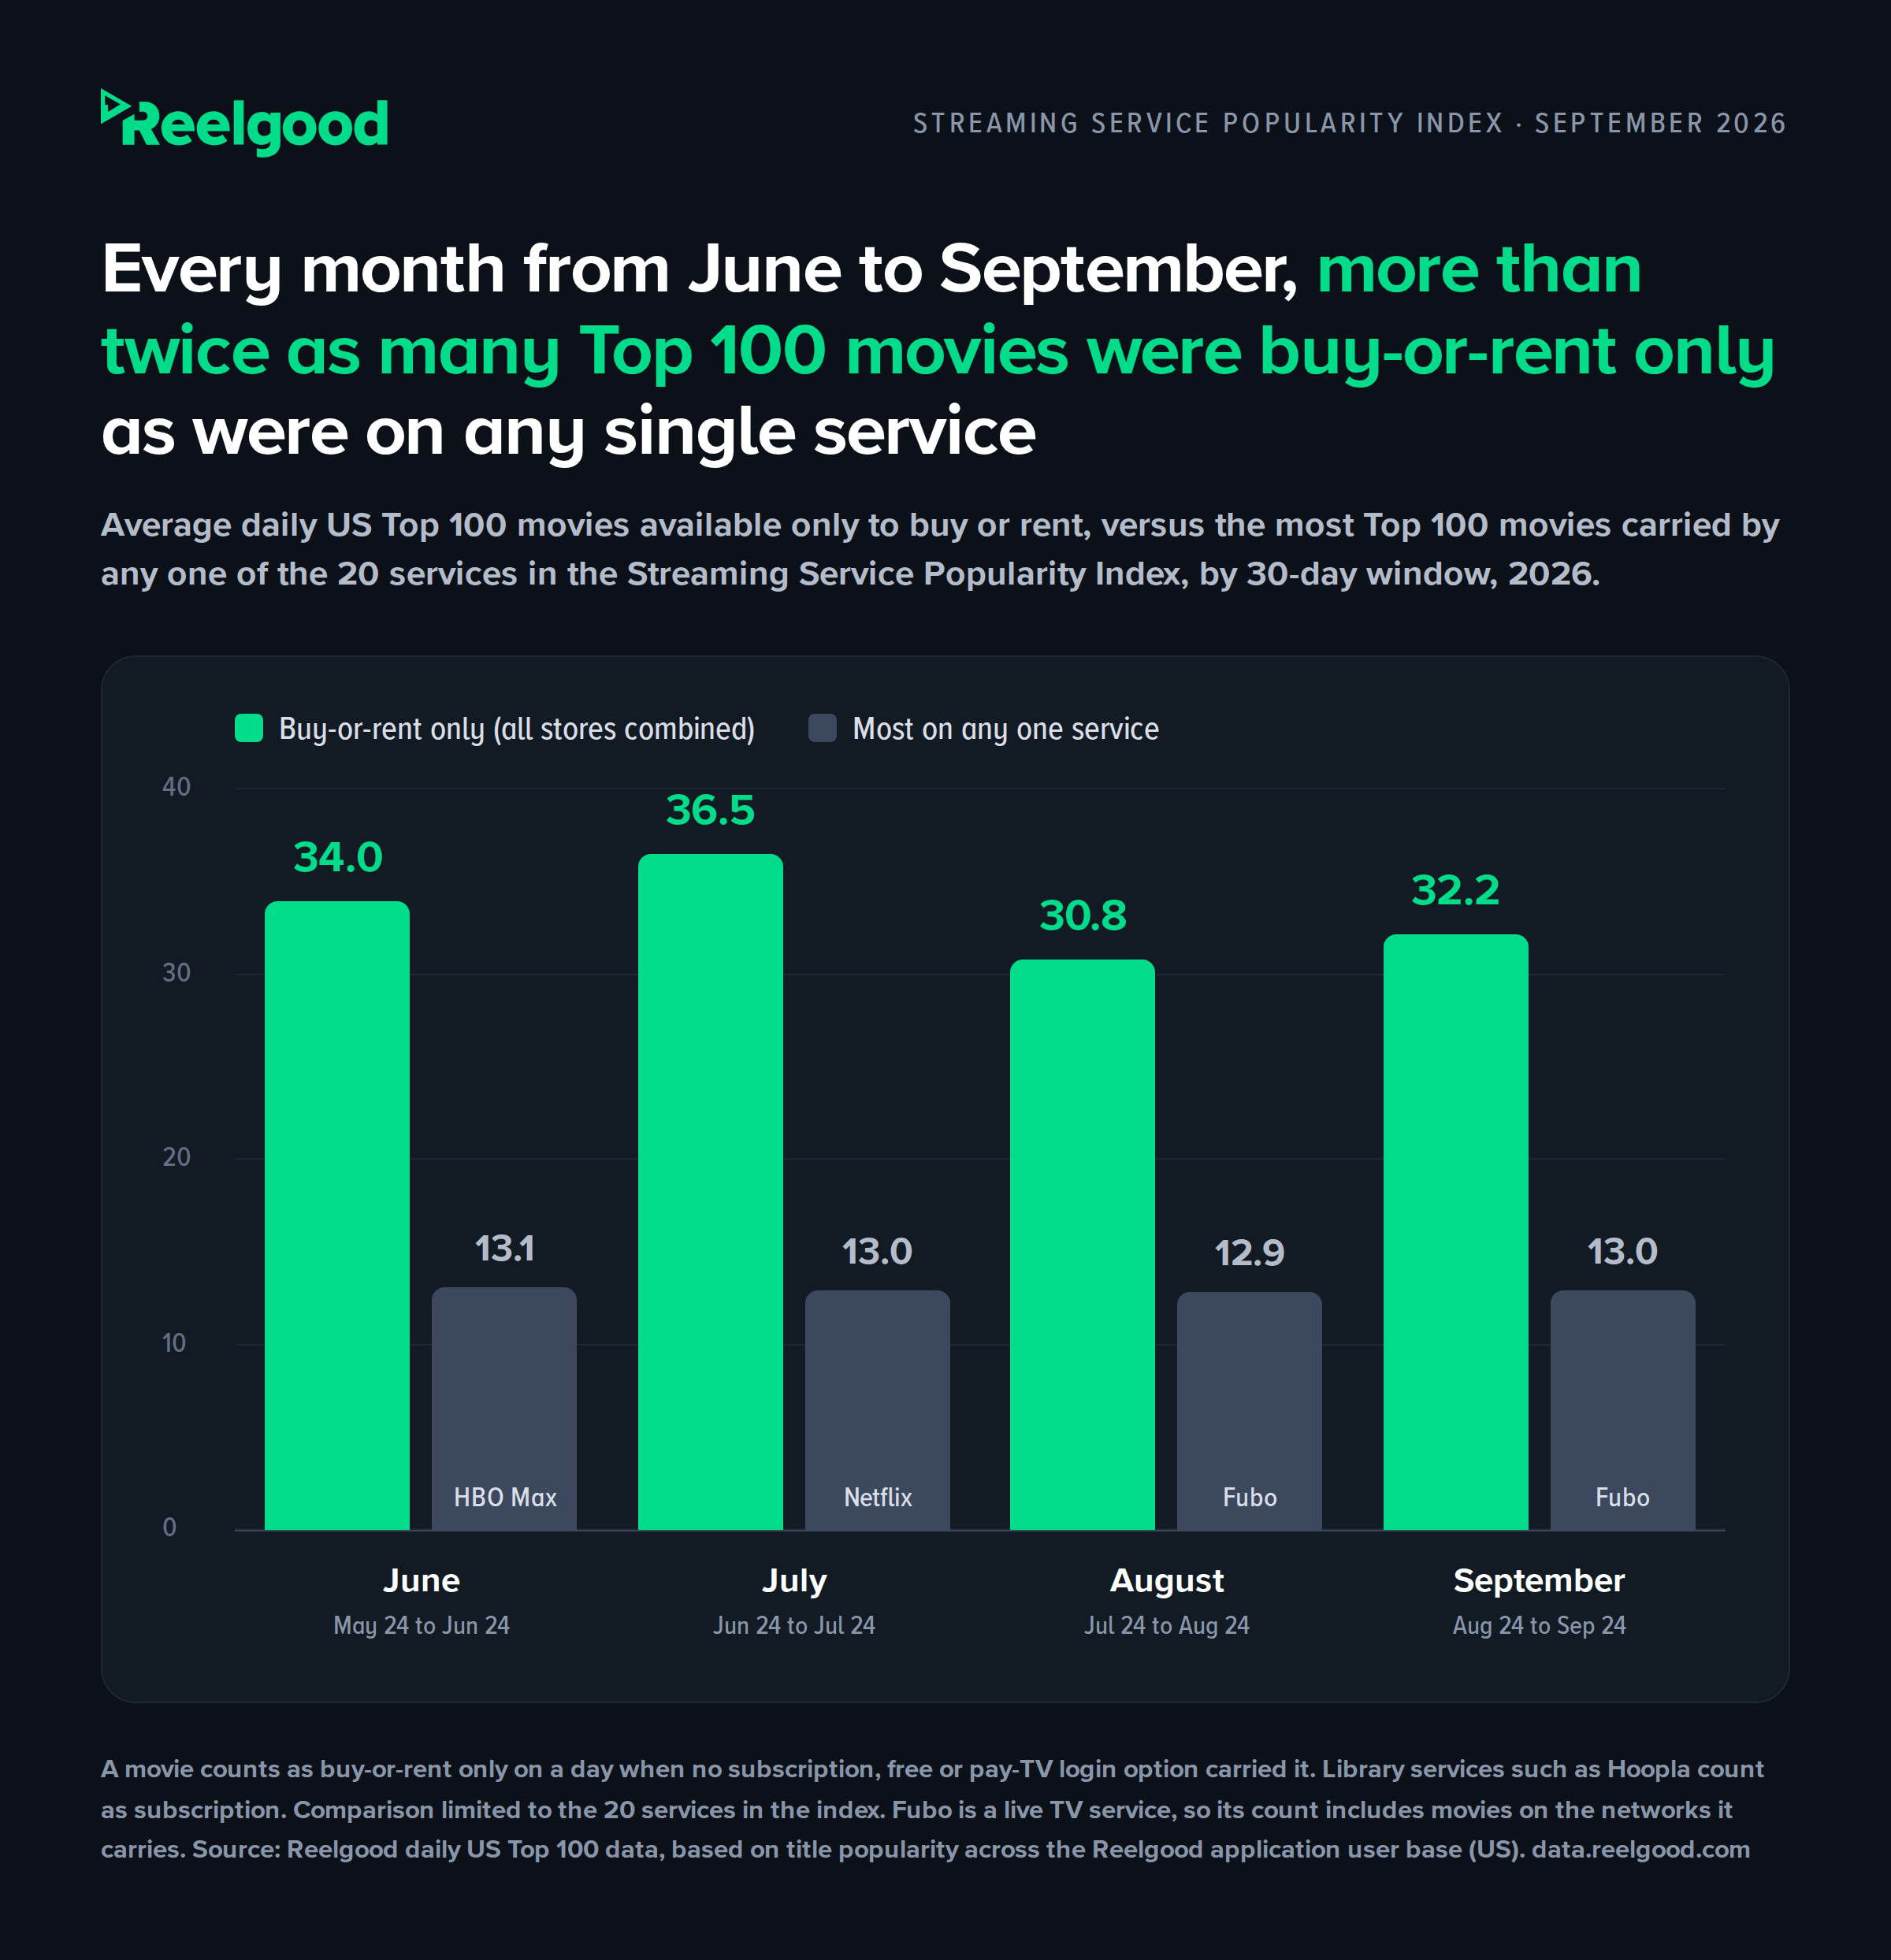
On an average day in every 30-day window from June to September, 30.8 to 36.5 of the US Top 100 movies were available only to buy or rent. Data: Reelgood daily US Top 100 (Streaming Service Popularity Index).
A third of the US Top 100 movies were available only to buy or rent
It reaches the top of the chart, too. On September 24, four of the top 10 movies were buy-or-rent only: The End of Oak Street at second, Backrooms at third, The Invite at sixth and Disclosure Day at seventh. In June, the No. 1 movie was buy-or-rent only on 25 of 32 days. That was Project Hail Mary, before it reached MGM+ on June 18. We wrote about what its run meant for related library titles in When Project Hail Mary Hit #1, The Martian Wasn’t Streaming.
TV works differently. In every window, fewer than two of the Top 100 shows were buy-or-rent only on an average day.
If your “where to watch” answer only checks subscription and free services, it has nothing to show for about a third of the most popular movies on any given day. Buy-or-rent availability belongs in the same answer.
Hokum spent 115 straight days in the Top 100 as a buy-or-rent movie
On September 24, 38 of the Top 100 movies were buy-or-rent only, and 11 of them had been that way for at least 40 straight days in the Top 100.
These ten had never been on a subscription or free service on any day of that run:
| Movie | Days in a row, buy-or-rent only |
Highest movie rank in that run |
|---|---|---|
| Hokum | 115 | 3 |
| The Furious | 80 | 15 |
| Backrooms | 73 | 2 |
| The Breadwinner | 70 | 26 |
| Disclosure Day | 66 | 3 |
| Leviticus | 59 | 33 |
| The Death of Robin Hood | 57 | 54 |
| Evil Dead Burn | 52 | 25 |
| The Invite | 45 | 3 |
| Minions & Monsters | 42 | 25 |
The eleventh went the other way. The Prestige was on Hulu and Peacock through August 1, by which point it had climbed to around 35th among movies. From August 2 it was buy-or-rent only on all 54 days it was in the Top 100 through September 24.
That is a different signal from the table above: a library film that kept a Top 100 audience for 54 days with no subscription or free option.
Our data can’t say where these films will stream next.
It can say how long the demand has been there.
For acquisition teams weighing pay-one and pay-two windows, every film in the table has had at least six weeks of Top 100 demand inside its buy-or-rent window.
37 movies moved from buy-or-rent to subscription streaming while still in the Top 100
Since early June, 37 movies spent at least two straight weeks in the Top 100 as buy-or-rent titles and then arrived on a subscription service while still in it. That is between 7 and 12 a month.
For the 18 whose Top 100 runs began after May 24, so that the full wait is measurable, the median was about six weeks.
September’s arrivals show how much that wait varies:
| Movie | Days in the Top 100 as buy-or-rent only |
Arrived on | Date |
|---|---|---|---|
| Star Wars: The Mandalorian and Grogu | 43 | Disney+ | Sep 2 |
| Scary Movie | 41 | Paramount+ | Sep 3 |
| Supergirl | 46 | HBO Max | Sep 12 |
| In the Grey | 102 | Starz | Sep 12 |
| Tuner | 90 | Paramount+ | Sep 21 |
| Citizen Vigilante | 88 (two runs) | Hoopla (library service) | Sep 22 |
| Toy Story 5 | 36 | Disney+ | Sep 23 |
The Mandalorian and Grogu has been in the Top 100 every day since July 21. Its highest movie rank was 20th before it reached Disney+ and 10th after.
For windowing teams, that spread is what a monthly snapshot hides.
We covered how to read this kind of sequence in our post on historical streaming availability data.
Netflix led the Streaming Service Popularity Index for a fourth month as Paramount+ rebounded
Netflix scored 9.88 out of 10 in September and has ranked first in every window since the index launched.
Paramount+ had the biggest gain, up from 14.1 to 18.1 titles in the Top 100 on an average day, which brings it within one title of June after two months of decline. Part of the gain came from titles that were already on Paramount+ in August, such as MobLand and Colin from Accounts.
HBO Max held at 20.2 titles after falling from 26.9 in June. Disney+ rose for a third straight month, to 14.0, helped by 23 days in the Top 100 on Disney+ for The Mandalorian and Grogu. Peacock fell from 18.9 to 15.8 and the free services from a combined 31.3 to 25.1, but both have changed direction every month since June, so neither is a trend.
The full ranking for all 20 services is on the index page.
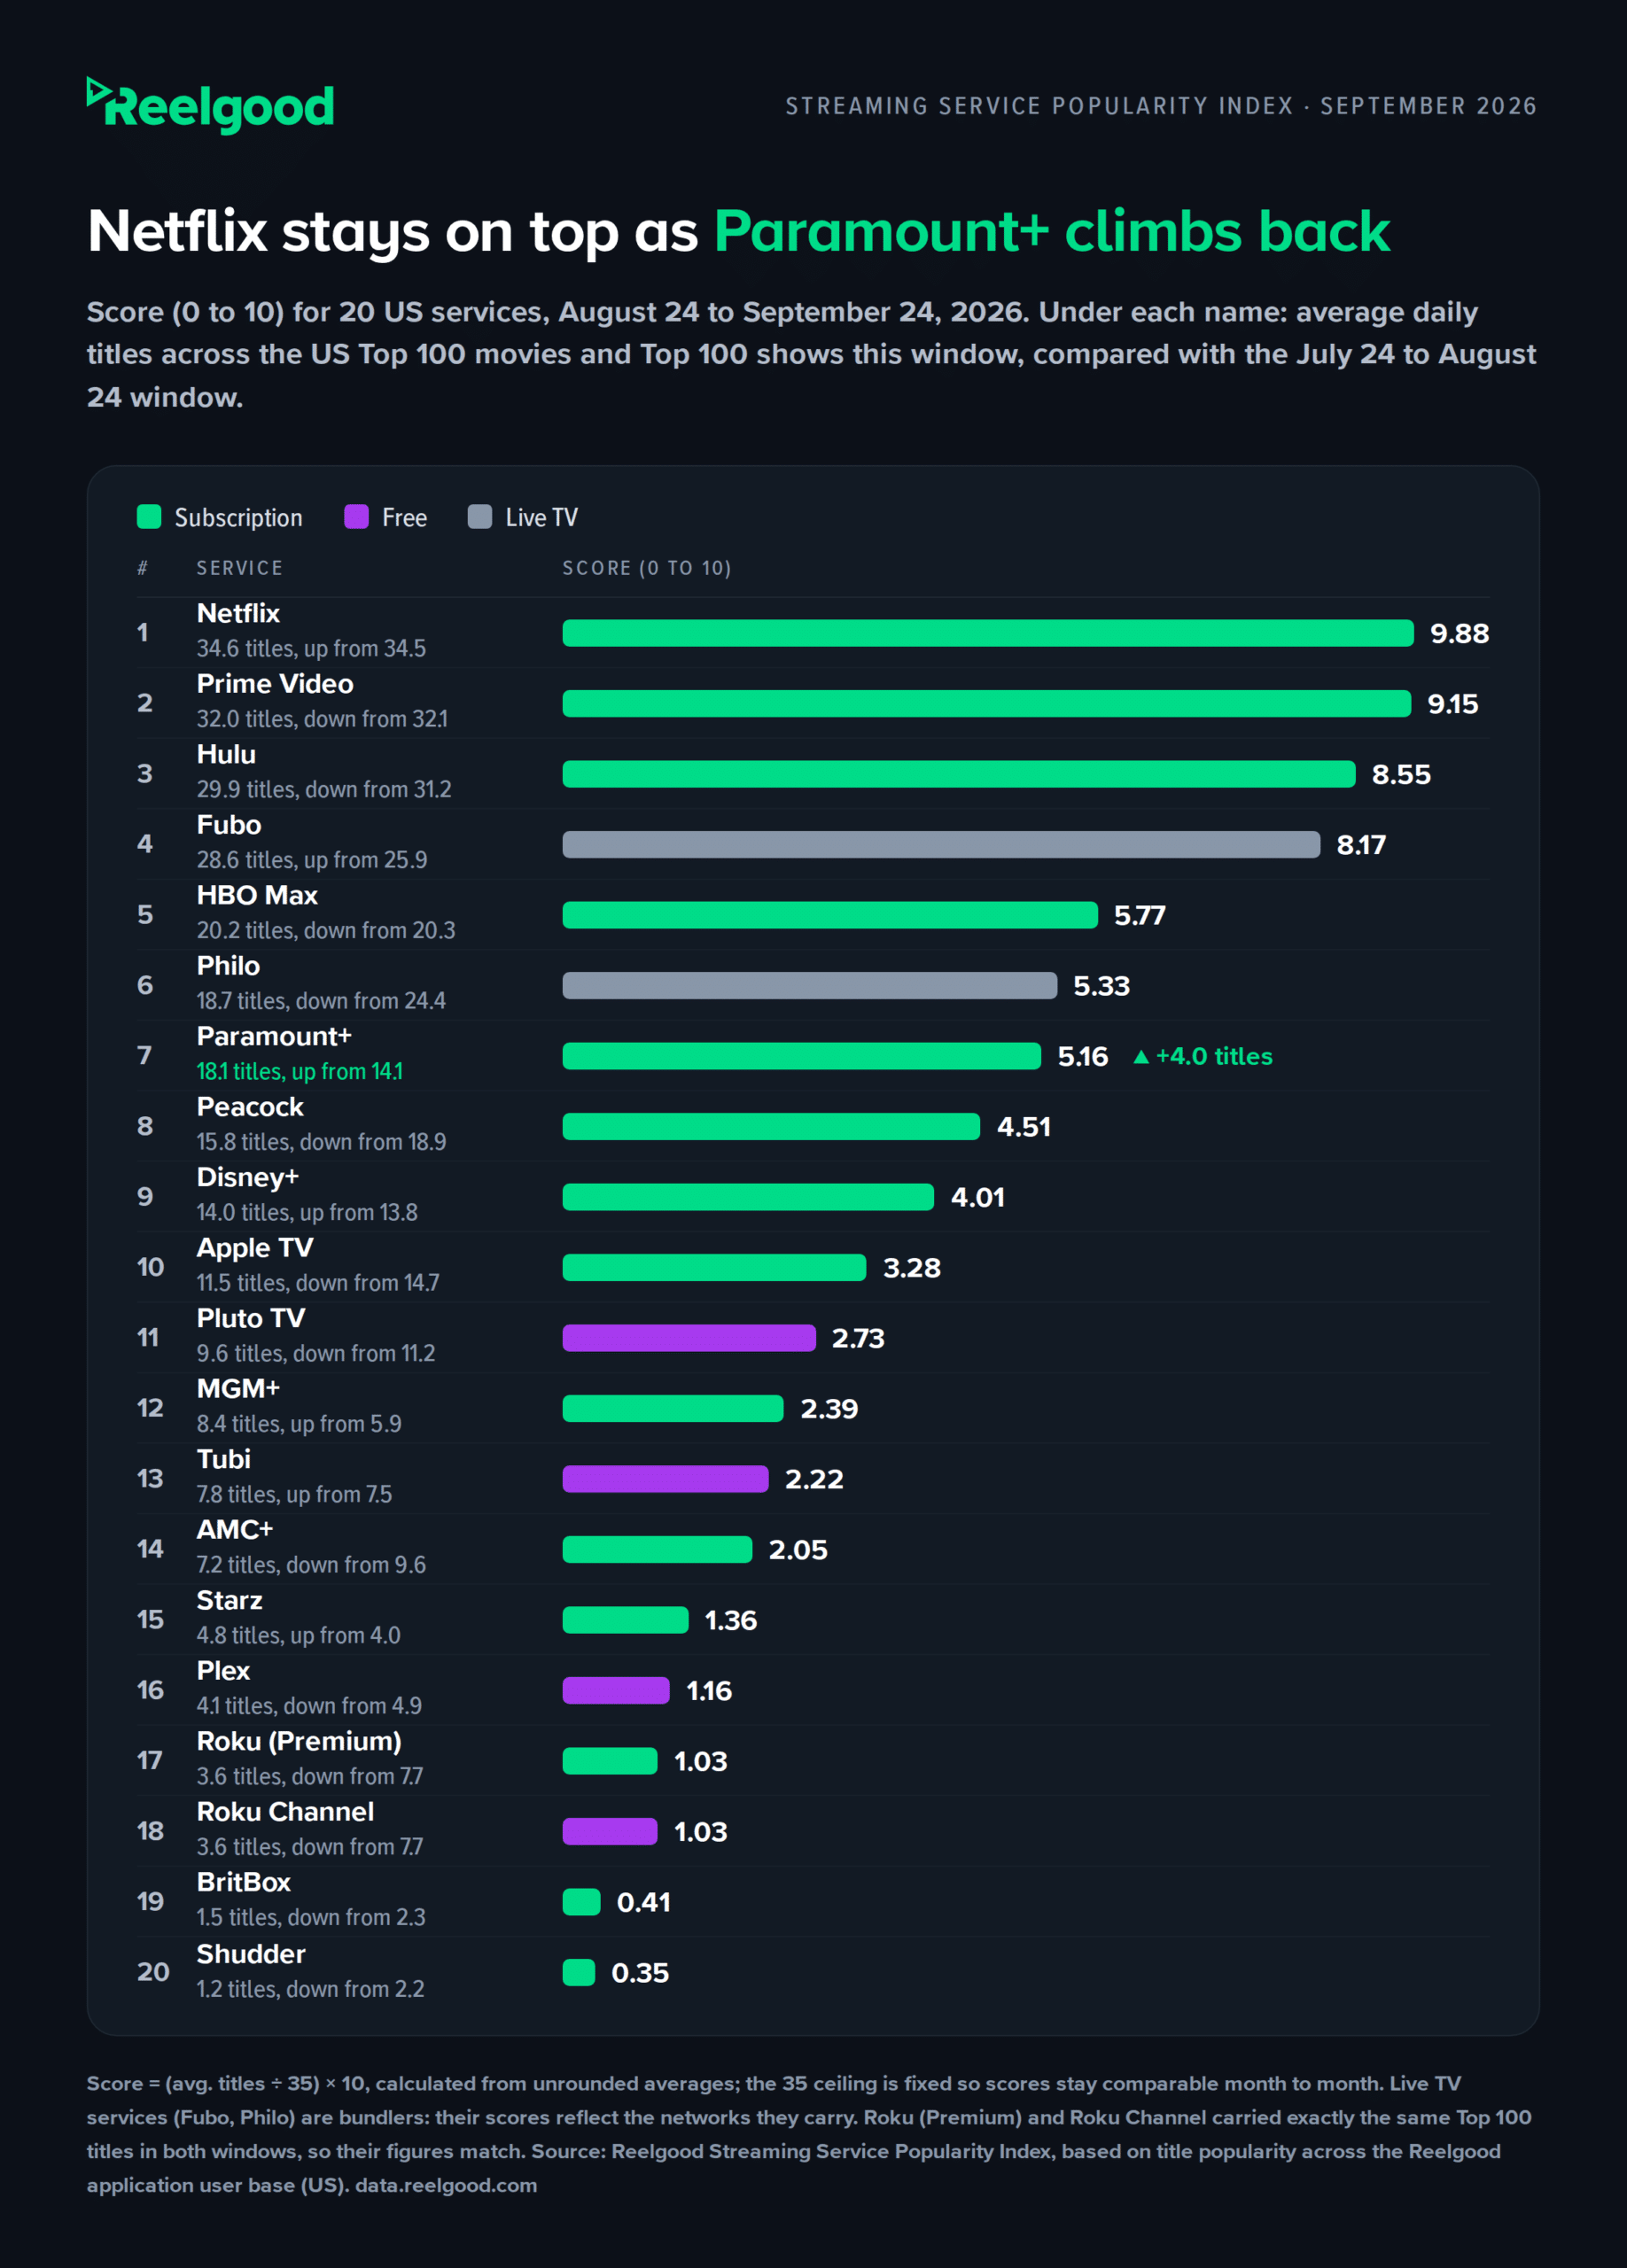
Netflix led the Streaming Service Popularity Index for September 2026 at 9.88 out of 10, its fourth straight month in first place, while Paramount+ had the largest gain. Data: Reelgood Streaming Service Popularity Index (US).
Day-level availability data shows when a popular movie reaches subscription streaming
Every finding in this post comes from a daily record of where titles stream:
- the day a film reached a subscription service,
- how many days it spent as buy-or-rent only before that,
- the day The Prestige left Hulu and Peacock.
Underneath the index, Reelgood tracks where titles stream across 300+ services globally, updated every few minutes, with US availability history back to 2019, dated to the day rather than the month. Two examples of what you could ask for:
- A slate of films you’re tracking: every service each one has streamed on, with dates, including the weeks it was available only to buy or rent.
- Your service or “where to watch” feature checked against the daily US Top 100: which popular movies you didn’t carry or show on each day, and how many of them were buy-or-rent only.
Email data@reelgood.com with the titles or service you care about, or use our data request form.
A movie counts as buy-or-rent only on a day when no subscription, free or pay-TV login option carried it. Library services such as Hoopla count as subscription services here. Each service’s 0 to 10 score (its Streaming Ranking Index) = (average titles in the US Top 100 movies and shows over a trailing 30-day window ÷ 35) × 10. The 35 ceiling is fixed rather than set by the leader, so scores stay comparable month to month. Windows: May 24 to June 24, June 24 to July 24, July 24 to August 24, and August 24 to September 24, 2026. Title-level figures come from Reelgood’s daily US Top 100 data for the same period.
Data: Reelgood Streaming Service Popularity Index, September 2026 (US).