HBO Max and Paramount+ Lost a Quarter of Their Top 100 Titles. Only One Left While Still Popular.
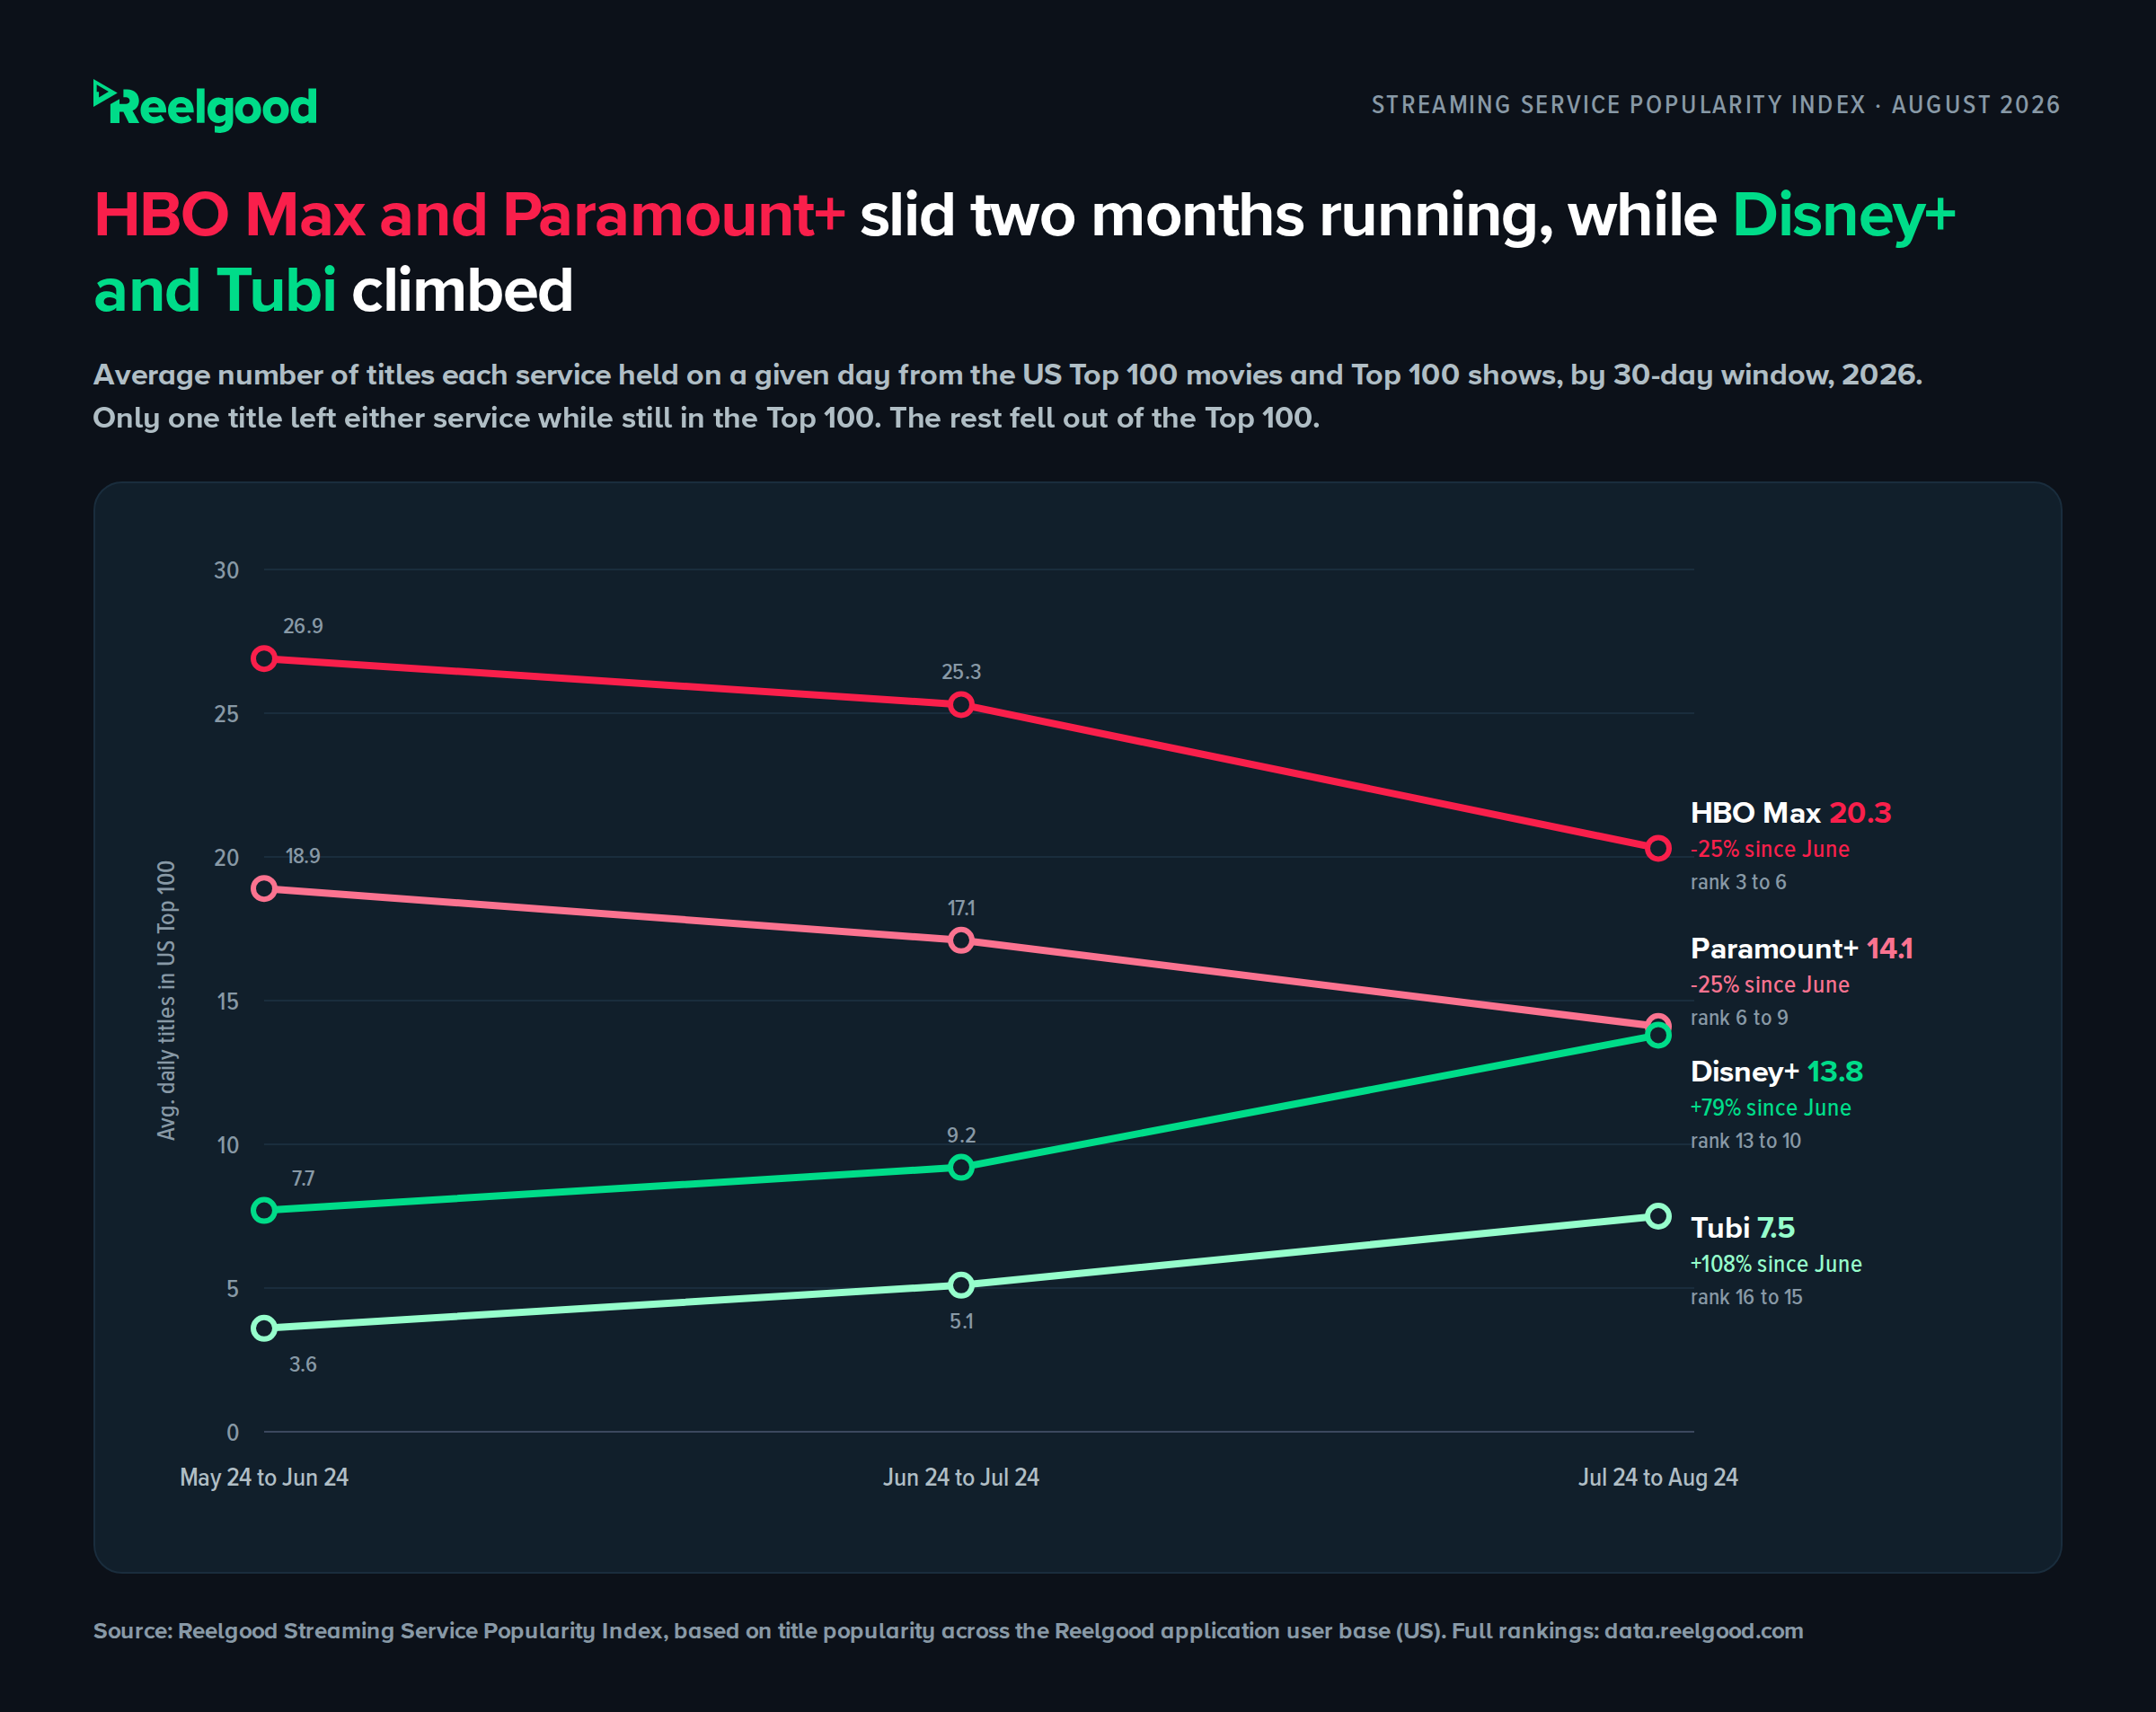
Since June, HBO Max and Paramount+ have each lost about a quarter of their most popular titles. Only one of those titles left either service while it was still in the Top 100.
On an average day between July 24 and August 24, 2026, the two carried a combined 34.4 titles from the US Top 100 movies and Top 100 shows, down from 45.8 in the window ending June 24. Across that entire decline, exactly one title left either service while it was still in the Top 100. The rest fell out of the Top 100.
That distinction changes what a falling score means.
A drop can mean titles left the service while they were still popular, or it can mean they fell out of the Top 100. The index alone cannot tell them apart. The daily title data underneath it can.
Over the same two months, Disney+ grew its count 79% and Tubi’s more than doubled. HBO Max and Paramount+ fell in both months. Disney+ and Tubi rose in both. That consistency is why this post focuses on these four rather than on August’s one-month swings.
The numbers come from Reelgood’s Streaming Service Popularity Index, which tracks how many of the country’s most in-demand titles each US service carries on an average day.
The full August ranking for all 20 services is below and on the index page.
Key takeaways
- HBO Max and Paramount+ carried fewer US Top 100 titles in each of the last two monthly windows, falling from a combined 45.8 titles to 34.4. HBO Max dropped from third to sixth, Paramount+ from sixth to ninth.
- The declines came from popular titles falling out of the Top 100: only The Devil Wears Prada left HBO Max while still in the Top 100, and no title left Paramount+ while still in it.
- Disney+ rose in both months, from 7.7 to 13.8 titles, helped by five Spider-Man films, and now sits 0.3 titles behind Paramount+.
- Tubi’s count rose from 3.6 to 7.5 titles, the largest gain among free, ad-supported services.
- Netflix led all three months and scored 9.85 out of 10 in August, its narrowest lead yet over third place.
HBO Max and Paramount+ carried fewer popular titles for two straight months
HBO Max had the third-deepest lineup of popular titles in June and July. In August it fell to sixth, with 20.3 titles on an average day, down from 26.9 in June. Paramount+ followed the same path at a lower level, from 18.9 titles to 14.1, sliding from sixth to ninth.
The daily Top 100 shows where the losses came from.
HBO Max’s June lineup leaned on recent films: Weapons, One Battle After Another, The Bride!, Wuthering Heights, and Greenland 2: Migration were in the Top 100 on HBO Max every day of the June window, and none of them made the Top 100 on any day in August.
Paramount+ lost ground the same way, mostly with shows. Marshals and Tracker dropped out entirely, and Ghosts appeared on one day in August after all 32 in June.
Just as telling is what didn’t happen.
Of every title HBO Max carried in June’s Top 100, only one left the service while it was still popular: The Devil Wears Prada, whose last Top 100 day on HBO Max was July 1. It stayed in the Top 100 for 40 more days on other services, including Disney+ and Hulu. Paramount+ had no such title. Both declines came from popular titles falling out of the Top 100, not from titles leaving while they were still popular.
HBO Max and Paramount+ are also the two services behind the combined library we sized up in our Paramount-WBD library analysis.
Disney+ and Tubi gained popular titles for two straight months
Disney+ posted the largest percentage gain of any subscription service across the three windows, from 7.7 titles on an average day in June to 13.8 in August. In June, Paramount+ carried 11.2 more popular titles than Disney+. In August, the difference was 0.3.
Much of that gain came from titles that weren’t in the Top 100 at all in June.
Five Spider-Man films entered the Top 100 on Disney+ between July 21 and August 9: Spider-Man: No Way Home, Spider-Man: Homecoming, Spider-Man: Far from Home, Spider-Man, and Spider-Man: Across the Spider-Verse. We tracked where the whole franchise streams in our Spider-Man availability analysis. The Devil Wears Prada 2 also spent 27 days of the August window in the Top 100 on Disney+, a few weeks after the original left HBO Max.
Tubi is the other steady riser, from 3.6 titles to 7.5. Its biggest August additions were shows: the series The Odyssey held a Top 100 spot on Tubi every day of the window (capitalizing on interest from the Christopher Nolan blockbuster), and Seeking Persephone joined on July 22 after appearing in the Top 100 elsewhere in June.
Netflix has led for three months, and the race behind it is the closest yet
Netflix scored 9.85 out of 10 in August and has ranked first in every window so far. Prime Video held second all three months. With HBO Max slipping, Hulu moved into third at 8.92, leaving the top three within a point of each other for the first time.
One note before the ranking: Fubo and Philo place fourth and fifth because they are bundlers. Their depth comes from the networks they carry rather than a catalog they own, so their score tracks what a subscriber can reach rather than what the service controls.
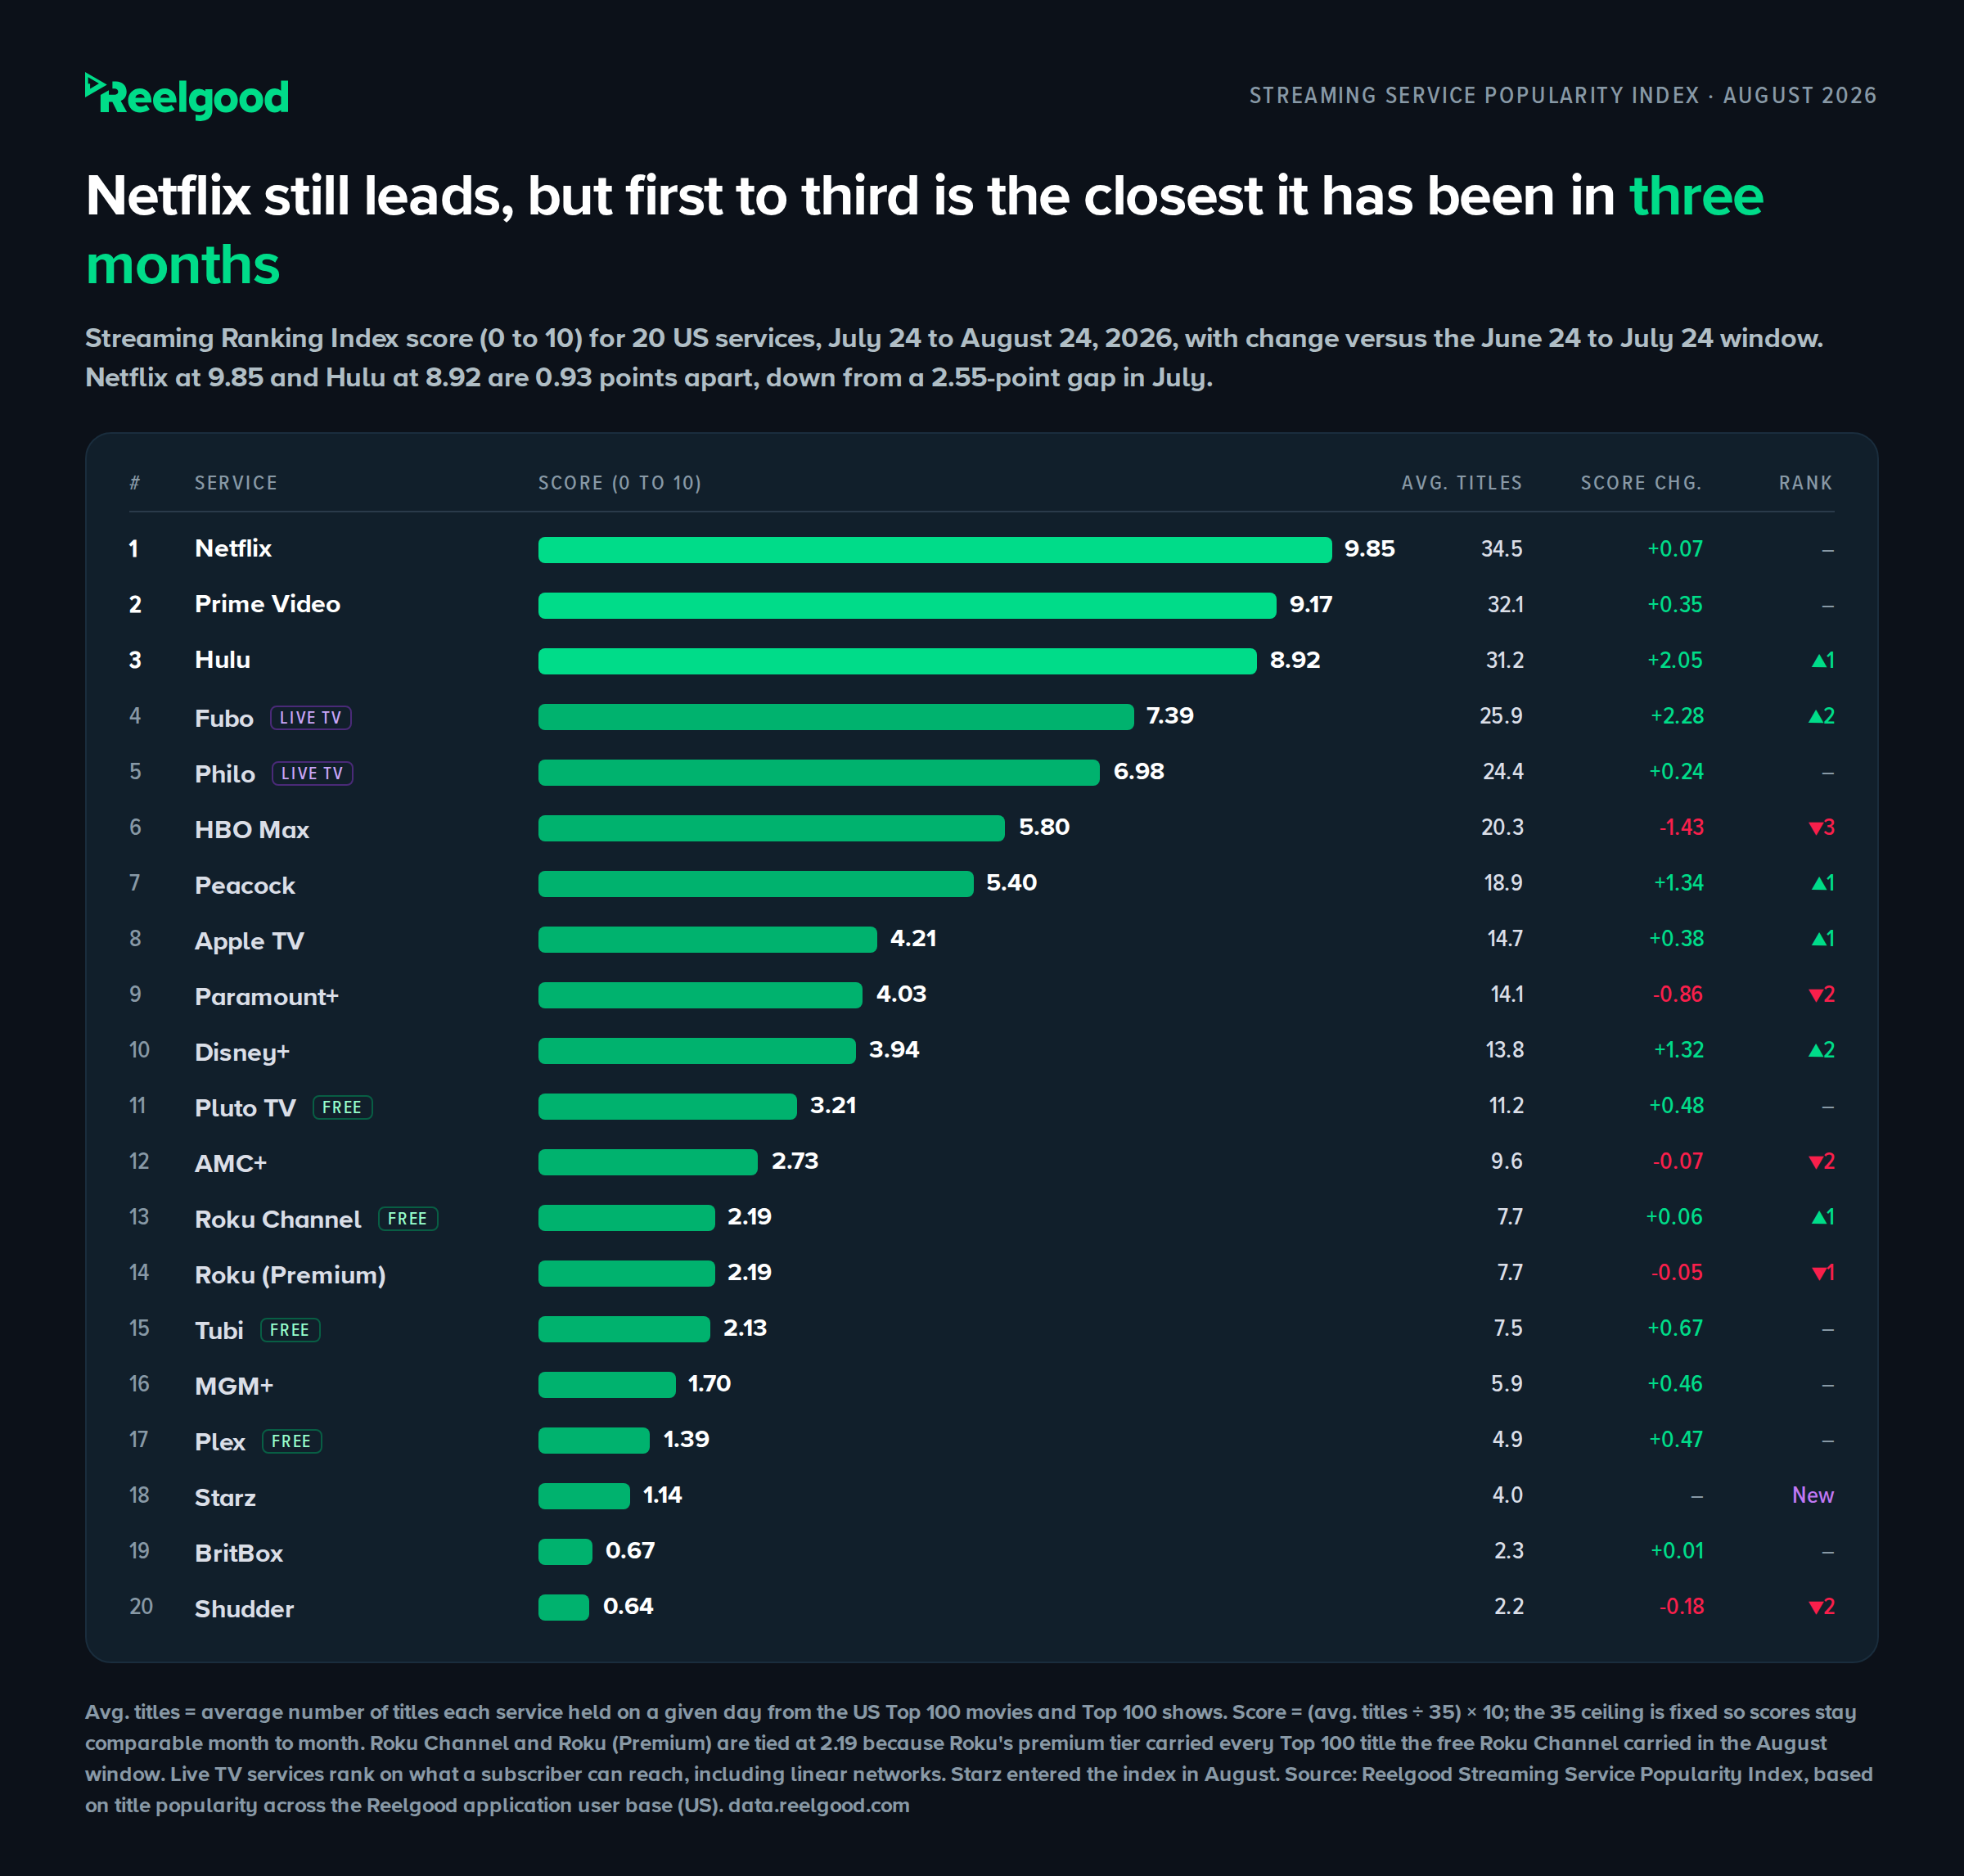
Netflix led the Streaming Service Popularity Index for August 2026 at 9.85 out of 10, with the top three services within 0.93 points, the closest first-to-third gap in the three months tracked. Data: Reelgood Streaming Service Popularity Index (US).
Two months in the same direction is a trend worth acting on; one month usually isn’t
August alone would have told a different story.
Free services jumped 24% from July, but July was a dip. Measured from June instead, the free tier is up about 8%, not 24%. Reading each month on its own would have pointed at the wrong services. Tubi is the real trend there.
If you license content, August is a caution against reading a falling score as a sign that a service is dropping titles or licensing fewer of them. Check which titles drove the score before reacting to it. A run of closed windows means your renewal terms are the conversation. A slate that simply cooled means the buyer needs new supply, which is a very different call to make. Telling the two apart takes historical streaming availability data.
If you track competitors, the habit worth keeping is to compare three windows before calling a trend. It’s also worth reading these results next to our look at which streamers own the weekly Top 10, since a service can hold on to its biggest hits while carrying fewer of the titles just below them.
Title-level availability data explains why a service’s popularity score moved
The index is a monthly summary. Underneath it,
Reelgood tracks where titles stream across 300+ services globally, updated every few minutes, with US availability history back to 2019, dated to the day rather than only the month.
Two examples of what that looks like as a data pull:
- For a service you license to: every US Top 100 title it gained or lost between May and August, the date each one arrived or left, and the split between titles that left the service and titles that fell out of the Top 100.
- For a competitor you track: the Top 100 titles it carries today and how that list has moved month to month.
Email data@reelgood.com with the service and window you care about, or use our data request form.
Streaming Ranking Index = (average titles in the US Top 100 movies and shows over a trailing 30-day window ÷ 35) × 10. The 35 ceiling is fixed rather than set by the leader, so scores stay comparable month to month. Windows: May 24 to June 24, June 24 to July 24, and July 24 to August 24, 2026. Title-level detail comes from Reelgood’s daily US Top 100 data for the same period.
Data: Reelgood Streaming Service Popularity Index, August 2026 (US).